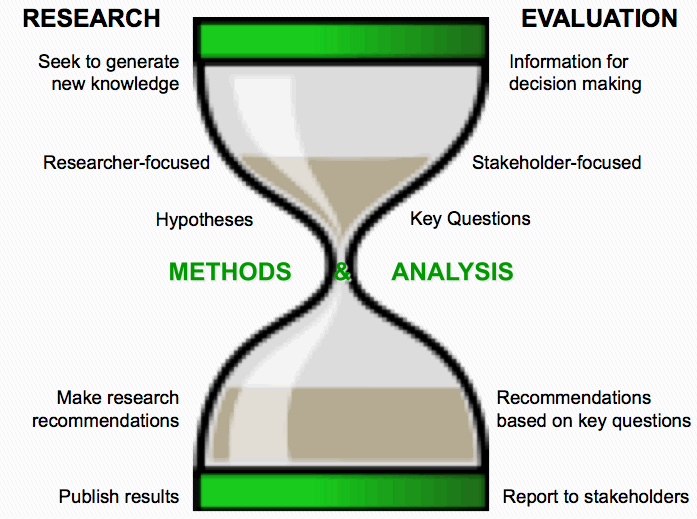
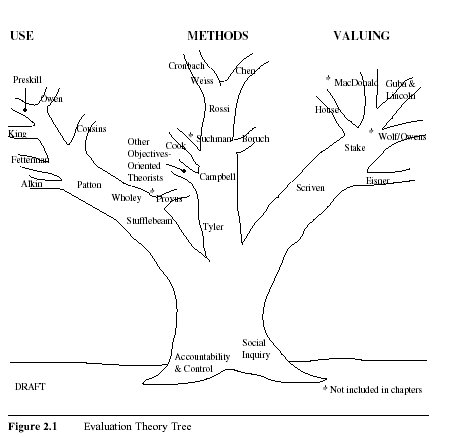
There are alternatives to Experimental and Quasi-Experimental Impact Evaluation Methods.

Some of my clients are really interested in measuring their impact. RCTs and other quasi-experiments are first on their list of suggested designs. But our repertoire of IE designs and methods have grown.


This DfID working paper says:

Most development interventions are ‘contributory causes’. They ‘work’ as part of a causal package in combination with other ‘helping factors’ such as stakeholder behaviour, related programmes and policies, institutional capacities, cultural factors or socio-economic trends. Designs and methods for IE need to be able to unpick these causal packages. 
Demonstrating that interventions cause development effects depends on theories and rules of causal inference that can support causal claims. Some of the most potentially useful approaches to causal inference are not generally known or applied in the evaluation of international development and aid. Multiple causality and configurations; and theory-based evaluation that can analyse causal mechanisms are particularly weak. There is greater understanding of counterfactual logics, the approach to causal inference that underpins experimental approaches to IE. 


Methods that I am currently interested in include 

Qualitative Impact Assessment Protocol 

The QuIP gathers evidence of a project’s impact through narrative causal statements collected directly from intended project beneficiaries. Respondents are asked to talk about the main changes in their lives over a pre-defined recall period and prompted to share what they perceive to be the main drivers of these changes, and to whom or what they attribute any change – which may well be from multiple sources.
Typically, a QuIP study involves 24 semi-structured interviews and four focus groups, conducted in the native language by highly-skilled, local researchers. However, this number is not fixed and will depend on the sampling approach used. The research team conducting interviews are independent and blindfolded where appropriate; they are not aware who has commissioned the research or which project is being assessed. This helps to mitigate and reduce pro-project and confirmation bias, as well as enable a broader and more open discussion with respondents about all outcomes and drivers of change.

Qualitative Comparative Analysis 

Qualitative Comparative Analysis (QCA) is a means of analysing the causal contribution of different conditions (e.g. aspects of an intervention and the wider context) to an outcome of interest. QCA starts with the documentation of the different configurations of conditions associated with each case of an observed outcome. These are then subject to a minimisation procedure that identifies the simplest set of conditions that can account all the observed outcomes, as well as their absence. The results are typically expressed in statements expressed in ordinary language or as Boolean algebra. QCA is able to use relatively small and simple data sets. There is no requirement to have enough cases to achieve statistical significance, although ideally there should be enough cases to potentially exhibit all the possible configurations. 

Picture this- Complexity

This handy poster made by Johanna Boehnert explains 16 terms that often pop up in thining about complex systems. It’s a bit like a gateway drug to reading more on Complex Systems.

If found it in a tweet by @Heinomatti which refers to the website of CECAN .
But Better Evaluation also has a really nice summary of it.

Systems Science and Complexity Science – related but not the same

I’m studying again and for that, I’m reading. A lot. I’m reading about systems thinking and factors that support sustained outcomes of development interventions. Often I stumble on things that make me go: “Ooh – I should remember this next time I do ABC” So this blog is being revived a bit to help keep track of these random thoughts.

I read about the history of systems thinking and complexity science and how both fields have similar challenges. Two great resources:

Midgley and Richardson comparison of paradigms in the Systems Field and the Complexity Field. 
Midgley’s reflection on the history of paradigm wars between systems scientists amongst themselves, and complexity scientists amongst themselves. He says: 

Systems scientists were embroiled in a paradigm war, which threatened to fragment the systems research community. This is relevant… because the same paradigms are evident in the complexity science community, and therefore it potentially faces the same risk of fragmentation.

My interest in reading about the relationship between systems science and complexity science got sparked when I looked for examples of emergence, feedback and self-organization in my data and couldn’t figure out what that would look like. A colleague suggested that while the concept “feedback” definitely occurs in multiple branches of the systems field (oh and there are so very very many), that the concepts “emergence” and “self-organization” are from complexity science.

One may argue that it probably doesn’t matter into which categories these concepts fall, but actually, it does. Because the ontological and epistemological assumptions that underly these paradigms may or may not be similar and should be questioned.

So to get my thinking about the concepts straight, I need to get my thinking about the paradigms straight. Its a work in progress….

Can you tell me “What works in…”

Although we reportedly now live in a post-evidence era, I still choose to cling to the minority view that programmes should be informed by research about what works. But where do you find the evidence?

About two years ago I attended a training course presented by Phil Davies from 3ie. He had many interesting insights to share, but today I was reminded of this excellent list of synthesised evidence that he shared.

One of my recent favourite systematic reviews, conducted by 3ie is The impact of education programmes on learning and school participation in low- and middle-income countries by Snilstveit et al . It has evidence about supplementary education programmes, feeding programmes, ICT in education programmes and a wide range of others. 
Happy Reading!  

Evaluative Rubrics – Helping you to make sense of your evaluation data

Three times in one week I’ve now found myself explaining the use of evaluation rubrics to potential evaluation users. I usually start with an example like this, that people can relate to:

When your high school creative writing paper was graded, your teacher most likely gave you an evaluative rubric which specified that you do well if you 1) used good grammar and spelling, 2) structured your arguments well, and 3) found an innovative and interesting angle on your topic. In essence, this rubric helped you to know what is “good” and what is “not good”.

In an evaluation, a rubric does exactly the same. What is a good outcome if you judge a post- school science and maths bridging programme? How does the outcomes of “being employed” or  “busy with a third year  B Sc. Degree at university” compare to an outcome like “being a self-employed university drop-out with three registered patents” or to an outcome like “being unemployed and not sure what to do about the future”. A rubric can help you to figure this out.

E. Jane Davidson has some excellent resources on rubrics here and here. If you need a rubric on evaluating value for investment, Julian King has a good resource here.  And of course, there is the usual great content on better evaluation here.

I love how Jane describes why we need evaluation rubrics:

Evaluative rubrics make transparent how quality and value are defined and applied. I sometimes refer to rubrics as the antidote to both ‘Rorschach inkblot’ (“You work it out”) and ‘divine judgment’ (“I looked upon it and saw that it was good”)-type evaluations.

Writing Summaries for Evaluation Reports

Last year I attended a course on “Using Evidence for Policy and Practice” presented by Philip Davies from the International Initiative for Impact Evaluation [3ie]. I found his guidelines for what should go into the 1:3:25 summaries most helpful. Here they are:
The full course material is available on the website of the African Evidence Network’s Website. Here

What I’m up to at the 2015 SAMEA Conference

The SAMEA conference is happening from 12 to 16 October and I’m looking forward to it. 


5thSAMEA Conference LogoSince January, I’ve had to temporarily downscale my professional involvement in the M&E and Educational networks and I had to neglect this little blog a bit because of a second long term development project I took on in January 2015. The project has lovely brown eyes, an infectious laugh and goes by the name of Clarissa. I’m happy to report that no major clashes with the first development project, (Named Ruan) has so far occurred, but its been a bit of an adjustment to balance work, and volunteering, and life in general. 


So what am I up to  at the conference?
I’ll be tweeting from @benitaw if you are interested in my perspective of the conference. I will also attend an IOCE stand at the conference, aiming to promote the VOPE Institutional Capacity Toolkit which my consultancy developed under the EvalPartners leadership of Jennifer Bisgard, Patricia Rogers, Jim Rugh, and Matt Galen. This is an online toolkit full of helpful resources aimed to equip VOPEs (Voluntary Organisations for Professional Evaluation) to become more accountable and more active. 

Then, I’ll be teaming up with Cara Waller (from CLEAR) and Donna Podems (from OtherWise) in a session for African VOPEs  on Friday 16th October. This is a ‘world-café’ style event, from 10 –11:30am, to be held as a joint ‘Made in Africa’ and ‘Discussing the Professionalisation of Evaluation and Evaluators’ stream session.  The aim of the session is to provide a space for those involved with VOPEs in the region (and those with an interest in strengthening African VOPEs) to come together to discuss current topics around building quality supply and generating demand for evaluation in contextually-specific ways. So please come and chat all things VOPE on the day!

Good luck to my colleague Fazeela Hoosen and the rest of the SAMEA board on hosting this year’s conference with the DPME and the PSC. I know (and boy…. do I know) it is very hard work. So thanks in advance for all of the hours you are putting in, to make this event happen. 

True Confessions of an Economic Evaluation Phobic

You know how the forces at work in the universe sometimes conspire and confronts you with a persistent nudge… over an over again? Well this week’s nudge was “You know nothing about economic evaluation… do something about it – Other than ignoring it”.

Words like “cost-benefit analysis, cost-efficiency analysis, cost-utility analysis”… actually anything with the word “cost” or “expenditure” in it… makes me nervous. So my usual strategy is to ignore the “Efficiency” criterion suggested by the OECD DAC, or I start fidgeting around for the contact details of one of my economist friends, and pass the job along. I have even managed to be part of a team doing a Public Expenditure Tracking Survey without touching the “Expenditure” side of the data.

But then I found these two resources that helped me to start to make a little bit more sense of it all. They are:

The South African Department of Planning Monitoring and Evaluation’s Guideline on Economic Evaluation  At least it starts to explain the very many different kinds of economic evaluation you should consider if you work within the context of South Africa’s National Evaluation Policy Framework.

And then this. 

http://www.julianking.co.nz/downloads/

A free ebook by Julian King that presents a short theory for helping to answer the question “Does XYZ deliver good (enough) value for investment?” – Essentially the question any evaluator is supposed to help answer.

So, now, there is one more topic on my ever expanding reading list! If there is a “Bible” of economic evaluation, let me have the reference, ok?

What if, mid career as a researcher, you become interested in Evaluation?

An old classmate, that took the market research route after completing her Research Psych Master’s Degree, asked me for a couple of references to check out if she wanted to develop her evaluation knowledge and skills. What came to mind is the following professional development resources. I’m sure there’s many more easily accessible ones, but this is a good start for a list!

  • If you are willing to spend some time learning from online lectures, try out any of the free online courses developed by EvalPartners, Rockefeller and the IOCE. New entrants allowed in January, March and September of each year, and learning is totally self-paced.  They are certified.
  • If you are looking for less intense professional development – Why not check out the American Evaluation Association’s Coffee Break Webinars? (I think you do have to be an AEA member though!)
  • If you are looking for something to read about any evaluation method, approach, tool or task, check out Better Evaluation. Subscribe to their blog and their twitter stream to get handy little tips. An amazing resource made available totally free!
  • Do you only have time for a short email or blog every now and again? Sign up for the American Evaluation Association Tip-a-Day blog/ emails or check out the collection of Evaluation Blogs curated at EvalCentral
  •  If you are looking for an accredited online course, try out the Claremont E-learning options. They usually have bursaries available for Developing Country Evaluators. 
  • What are the two Evaluation books I suggest you should read first? Utilization Focused Evaluation  – Michael Quinn Patton and Purposeful Programme Theory – Sue Funnell & Patricia Rogers
  • If you are planning to work in the M&E of Government programmes in South Africa, you have to be familiar with The South African Department of Planning, Monitoring and Evaluation’s National Evaluation Policy Framework, and their guidelines.

Further Resources and Links for those who attended the Bridge M&E Colloquium on 12 August 2014

Today, I got the opportunity to present to the Bridge M&E Colloquium on the work I’m doing with the CSIR Meraka Institute on the ICT4RED project. My first presentation gave some background about the ICT4RED project. 

I referred to the availability of the Teacher Professional Development course under a creative commons licence here, – This resource also includes a full description of the micro-accreditation system or Badging system. 

What seemed to get the participants in the meeting really excited is the 12 Component model of the project – which seems to suggest that one has to pay attention to much more than just technology when you implement a project of this nature. My colleagues published a paper on this topic here.

Participants also resonated with the “Earn as you Learn” model that the project follows – If teachers demonstrate that they comply with certain assessment criteria, they earn technology and peripherals for themselves and for their schools. A paper on the gamification philosophy that underlies the course, is available here.  The Learn to Earn model was documented in a learning brief here.

And then I was able to speak a little more about the evaluation design of the project. The paper that underlies this work is available here, and the presentation is accessible below:

I think what sets our project evaluation apart from many others being conducted in South Africa, is that it truly uses “Developmental Evaluation” as the evaluation approach. For more information about this (and for a very provocative evaluation read in general), make sure you get your hands on Michael Patton’s book. A short description of the approach and a list of other resources can also be found here.

People really liked the idea of using Learning Briefs to document learning for / from team members, and to share with a wider community. This is an idea inspired by the DG Murray Trust. I blogged about the process and template we used before. An example of the learning brief that the M&E team developed for the previous round, is available here. More learning briefs are available on the ICT4RED blog.

I also explained that we use the Impact Story Tool for capturing and verifying an array of anticipated and unanticipated impacts. I’ve explained the use and analysis of the tool in more detail in another blog post. There was immediate interest in this simple little tool.

A neat trick that also got some people excited, is how we use Survey Monkey. To make sure that our data is available quickly to all potential users on the team, we capture our data (even data collected on paper) in Survey Monkey, and then share the results with our project partners via the sharing interface on Surveymonkey – even before we’ve really been able to analyse the data. The Survey Monkey site, explains this in a little more detail with examples.

The idea of using non-traditional electronic means to help with data collection also got some participants excited. I explained that we have a Whatsapp group for facilitators, and we monitor this, together with our more traditional post-training feedback forms, to ascertain if there are problems that need solving. In an upcoming blog post, I’ll share a little bit about exactly how we used the WhatsApp data, and what we were able to learn from it.

Exciting Learning from people involved in South African ICT in Education

I’ve been fortunate to be invited to a small gathering of people working with Coza Cares in the ICT space in South Africa. The luxury of sitting down for two days and listening to people talk about what they are passionate about, is something to truly savour.

I did a presentation on some ideas I have to define and measure learners’ 21st Century Skills in the context of the ICT4RED project. I currently have more questions than answers, but I’m sure we will get there soon. Here is a link to a summary table comparing different Definitions of 21st Century Skills.

Other presentations I really enjoyed was
* Barbara Dale Jones on the role of Bridge and learning communities and knowledge management
* Fiona Wallace, on the CoZaCares model of ICT intervention
* John Thole on Edunova’s programme to train and deploy youth to support ICT implementation in Schools
* Siobhan Thatcher from Edunova’s presentation on Edunova’s model for deploying Learning Centres in support of Schools
* Brett Simpson from Breadbin Interactive on the learning they’ve done on the deployment of their content repository.
*Ben Bredenkamp from Pendula ICT talking about their model for ICt integration and experience of the One Laptop per Child project in South Africa.
* Dylan Busa from Mindset speaking about the relaunch of their website content.
* Merryl Ford and Maggie Verster talking about the ICT4RED project

Impact Evaluation Guidance for Non-profits

Interaction has this lovely Guidance note and Webinar Series on Impact Evaluation available on their website.

Impact Evaluation Guidance Note and Webinar Series

With financial support from the Rockefeller Foundation, InterAction developed a four-part series of guidance notes and webinars on impact evaluation. The purpose of the series is to build the capacity of NGOs (and others) to demonstrate effectiveness by increasing their understanding of and ability to conduct high quality impact evaluation.
The four guidance notes in the series are:

  1. Introduction to Impact Evaluation, by Patricia Rogers, Professor in Public Sector Evaluation, RMIT University
  2. Linking Monitoring & Evaluation to Impact Evaluation,  by Burt Perrin, Independent Consultant
  3. Introduction to Mixed Methods in Impact Evaluation, by Michael Bamberger, Independent Consultant
  4. Use of Impact Evaluation Results, by David Bonbright, Chief Executive, Keystone Accountability

Each guidance note is accompanied by two webinars. In the first webinar, the authors present an overview of their note. In the second webinar, two organizations – typically NGOs – present on their experiences with different aspects of impact evaluation. In addition, each guidance note has been translated into several languages, including Spanish and French. Webinar recordings, presentation slides and the translated versions of each note are provided on the website.

Resources on Impact Evaluation

This post consolidates a list of impact evaluation resources that I usually refer to when I am asked about impact evaluations. 

This cute video explains the factors that distinguishes impact evaluation from other kinds of evaluation, in two minutes. Of course randomization isn’t the only way of credibly attributing causes and effects – and this is a particularly hot evaluation methodology debate.  For an example of why this is sometimes an irrelevant debate – see this write up on parachutes and Chris Lysy’s cartoons on the topic.

Literature on the Impact Evaluation Debate

The Impact Evaluation debate flared up after this report, titled “When will we ever learn” was released in 2006. In the States there also was a prominent funding mechanism which required programmes to include experimental evaluation methods in their design, or not get funding (from about 2003 or so).

The bone of contention was that Randomized Control Trials (RCTs) and Experimental methods (and to some extent Quasi Experimental Designs) were held up as the “gold standard” in evaluation. Which, in my opinion, is nonsense. So the debate about what counts as evidence started again. The World Bank and big corporate donors were perceived to push for Experimental Methods, Evaluation Associations (with members committed to mixed methods) pushed back saying methods can’t be determined without knowing what the questions are. And others pushed back saying that RCTs are probably applicable in only about 5% of the cases in which evaluation is necessary.

The methods debate in Evaluation is really an old debate. Some really prominent evaluators decided to leave the AEA because they embarked on a position that they equated with “The flat earth movement” in geography.  Here is a nice overview article, (The 2004 Claremont Debate: Lipsey vs. Scriven. DeterminingCausality in Program Evaluation and Applied Research: Should ExperimentalEvidence Be the Gold Standard?) to summarise some of it.

The Network of Networks in Impact evaluation then sought to write a guidance document, but even after this was released, there was a feeling that not enough was said to counter the “gold standard” mentality.  This document, titled “Designing impact evaluations, different perspectives” provides a bit more information on the “other views”.

Literature on Impact Evaluation Methods

 If you are interested in literature on Evaluation Methods, look at Better Evaluation to get a quick overview.

I like Cook, Campbell and Shadish to understand experimental and quasi experimental methods, but this online knowledge base resource is good too.
 
For some resources on other more mixed methods approaches to impact evaluation, you need to look at Realist Synthesis, General Elimination Method, Theory Based Evaluation, and something that I think has potential, the Collaborative Outcomes Reporting approach. 

The South African Department for Performance Monitoring and Evaluation’s guideline on Impact Evaluation is also relevant if you are interested in work in the South African Context.

Getting authorisation to do Research and Evaluation in Schools

 
A colleague working in an educational NGO asked this question, about working in schools in South Africa:
I just wanted to ask a quick question. Do I need to get permission from the relevant Provincial Department of Education to carry out research in schools if the schools are part of a project we’re running? In other words, the district is aware of us and probably interacting with us?
 
My answer: 
I’ve only done research or evaluations in a few Provinces, not all of them, but in all of those Provinces the Education Departments have guidelines for researchers that require you to fill in forms, submit your research proposal (and sometimes evaluation instruments) for review, and also binds you to some promises about the use of your research or evaluation findings. (E.g. the Province may require copies of reports, may require you to present your findings, etc.) Check any of the Provinces’ annual reports to see which Director in the Provincial office is in charge of Research, and lodge your enquiry about requirements there, if you can’t find details on the Provincial Education Website.
The officials in Education Districts are often not aware of the Provincial requirements, so one might be able to get away without Provincial authorization, but this is a bad idea for at least two reasons: 
* It helps if the Research Directorate in the Provincial Education Department have your details on their database because it promotes use and coordination of research, and
*It can solve a lot of headaches for you should someone complain about your research going forward. 
Since Education in schools is a Provincial competence, I have been unable to get blanket approval from National Education to work in multiple Provinces – so that meant filling in the different forms and providing the different details to the different Provinces, and following up on the outcome of each of these processes.

Besides Provincial approval, some clients might also require that any human subject research gets vetted by a research ethics approval board, like the ones attached to universities, or science councils. I’ve only dealt with a few of these, but they mostly require you to prove that you have authorization to conduct the research, so the two goes hand in hand.

Of course approval by the Province and Research Ethics Boards are still not all that you need to do to ensure that you conduct your work ethically – Some fields (E.g. Marketing Research – see the ESOMAR guidelines),  have guidelines about ethics… so it would be good to study these and make sure your practice remains above board.

And then this, of course, is also true:

Live one day at a time emphasizing ethics rather than rules.
Wayne Dyer


I am because you are

In a previous blogpost I reflected on how African values shape my practice of Evaluation.

This week I attended a seminar during which Gertjan Van Stam shared some provocative views on development in Africa. I started reading his book ‘Placemark‘. I love the way he gives voice to rural Africa. I find it interesting that this Dutch Engineer manages to give voice to Africa in a way that I can relate with.

His beautifully written take on Ubuntu:

I am, because You are

Is it possible that people in rural areas of Africa can connect with people in urban areas around the world?

That one can walk into a scene and meet someone who walks into the same scene, even if it is geographically separated?

That we explore and connect rural and urban worlds worldwide without anyone being forced into cultural suicide?

That we meet around the globe and relate, embrace, love, and build meaningful relationships?

That we find ways to be of significance and support to each other and together shuffle poverty and disease into the abyss?

That we encourage each other to withstand drunkenness and drugs, bullying, self harm, and greed?

That we share spiritual nutrition to deal with wealth, loss, alienation and pain in this generation?

That we unite through social networks, overcoming divides and separations?

That we share ancient, tested, and new resources, opportunities, visions, and dreams that lead to knowledge, understanding and wisdom?

That we collaborate to discuss, and engineer tools, taking into account the integral health of all systems?

That together, South and North, build capacity, mutual accountability, and progress, for justice and fairness?

That I am, because You are?

21st Century Skills of Rural African Teachers and Learners


I’m evaluating a project that aims to build the 21st century skills of rural African teachers and learners. Until recently I did not even know what people meant when they used the phrase 21st Century skills, but I have been enlightened and must now find a way to measure it for our evaluation. 
It seems I’m not the only one struggling with the problem of having to measure something very broad – There are a range of resources available that wrangle with the idea of defining and measuring 21st Century Skills – Some of the resources I found particularly useful include:
Everything I read, however, seems to have the focus on a context that is not rural and not African. Perhaps there is scope for our project to contribute to the general discussion on 21st Century Skills by adapting the definitions and measures specifically for our context? Perhaps this is an opportunity to develop an example of African Made, African Owned Evaluation?

My plans for AfrEA 2014 conference

I’m off to Cameroon on Sunday for a week of networking, learning and sharing at the 2014 AfrEA conference in Yaondé. I love seeing bits of my continent. If internet access is available I’ll try to tweet from @benitaW.

I am facilitating a workshop on Tuesday together with the wise Jim Rugh and the efficient Marie Gervais to share a bit about a VOPE toolkit EvalPartners is developing. ( A VOPE is an evaluation association or society… voluntary organization for professional evaluation)

Workshop title:Establishing and strengthening VOPEs: testing and applying the EvalPartners Institutional Capacity Toolkit

Abstract: One of the EvalPartners initiatives, responding to requests received from leaders of many VOPEs (Voluntary Organizations for Professional Evaluation), is to develop a toolkit which provides guidance to those who wish to form even informal VOPEs, and leaders of existing VOPEs who seek guidance on strengthening their organization’s capacities.  During this workshop participants will be introduced to the many subjects addressed in the VOPE Institutional Capacity Toolkit, and asked to test the tools as they determine how they could help them apply such resources in strengthening their own VOPEs.

The workshop will be very interactive with lots of exploring, engaging, and evaluating of the toolkit resources. Participants should not come to this workshop expecting that they will sit still for more than 30 minutes at a time. We’ll use a combination of learning stations and fishbowls as the workshop methodology.  I’m really looking forward to it!

Eventually the toolkit will be made available online. Follow @vopetoolkit on twitter for more news about developments.

I served on the boards of both AfrEA and SAMEA so I hope that the resources that the Toolkit task force and their marvellous team of collaborators put together in the toolkit will be of use to colleagues across the continent who are still founding or strengthening their VOPEs. It is hard and sometimes thankless work to serve on a VOPE board, and if this toolkit can make someone’s life a little easier with examples, tools and advice, I would count this as a worthy effort.

I expect that the workshop will be a good opportunity to get some Feedback to guide us in the completion of the work.

Working Rigorously with Stories – Impact Story Tool


I’ve had some people email me about a paper I presented at the 2013 SAMEA conference. This paper introduces a tool for collecting and rigorously analysing impact stories that could be used as part of an evaluation. The full paper with the tool can be accessed here. The abstract is presented below:

 Beneficiary stories are an easily collected data source, but without specific information in the story, it may be impossible to attribute the mentioned changes to an intervention or to verify that the change actually occurred. Approaches such as Appreciative Inquiry and the Most Significant Change Technique have been developed in response to the need to work more rigorously with this potentially rich form of data. The “Impact Story Tool” is yet another attempt to make the most of rich qualitative data and was developed and tested in the context of a few programme evaluations conducted by Feedback RA.
The tool consists of a story collection template and an evaluation rubric that allows for the story to be captured, verified and analysed. Project participants are encouraged to share examples of changes in skills, knowledge, attitudes, motivations, individual behaviours or organizational practice. The tool encourages respondents to think about the degree to which the evaluated programme contributed towards the mentioned change, and also asks for the details of another person that may be able to verify the reported change. The analyst collects the story, verifies the story and then codes the story using a rubric. When a number of stories are collected in this way, they are then analysed together with other evaluation data. It may illuminate which parts of a specific intervention are most frequently credited with contributing towards a change.

Besides introducing the tool as it was used in three different evaluations, the usefulness of this tool and possible drawbacks are discussed.

 (The picture above is of a character known as “Benny Bookworm” from a South African TV show called “Wielie Walie” which I watched as a child)

Reflection: Thanks Tom Grayson

So since I started a stroll down memory lane, I thought I’d share this too. In 2002 I decided I wanted to be an evaluator. I was working at an evaluation company, and I decided to start my own consultancy, so I was getting great practical exposure.  But I really did not have a good academic grounding in the theory and literature surrounding Evaluation. This was back in the day when there weren’t MOOCS and webinars… so I had to READ to get my education.

During my studies I had read Cook and Campbell, and somehow I also stumbled upon Guba and Lincoln. I was introduced to Utilization Focused Evaluation.  In 2004 I got Rossi, Lipsey and Freeman for a going away present from Khulisa, and I read any evaluation journal articles I could lay my hands on.

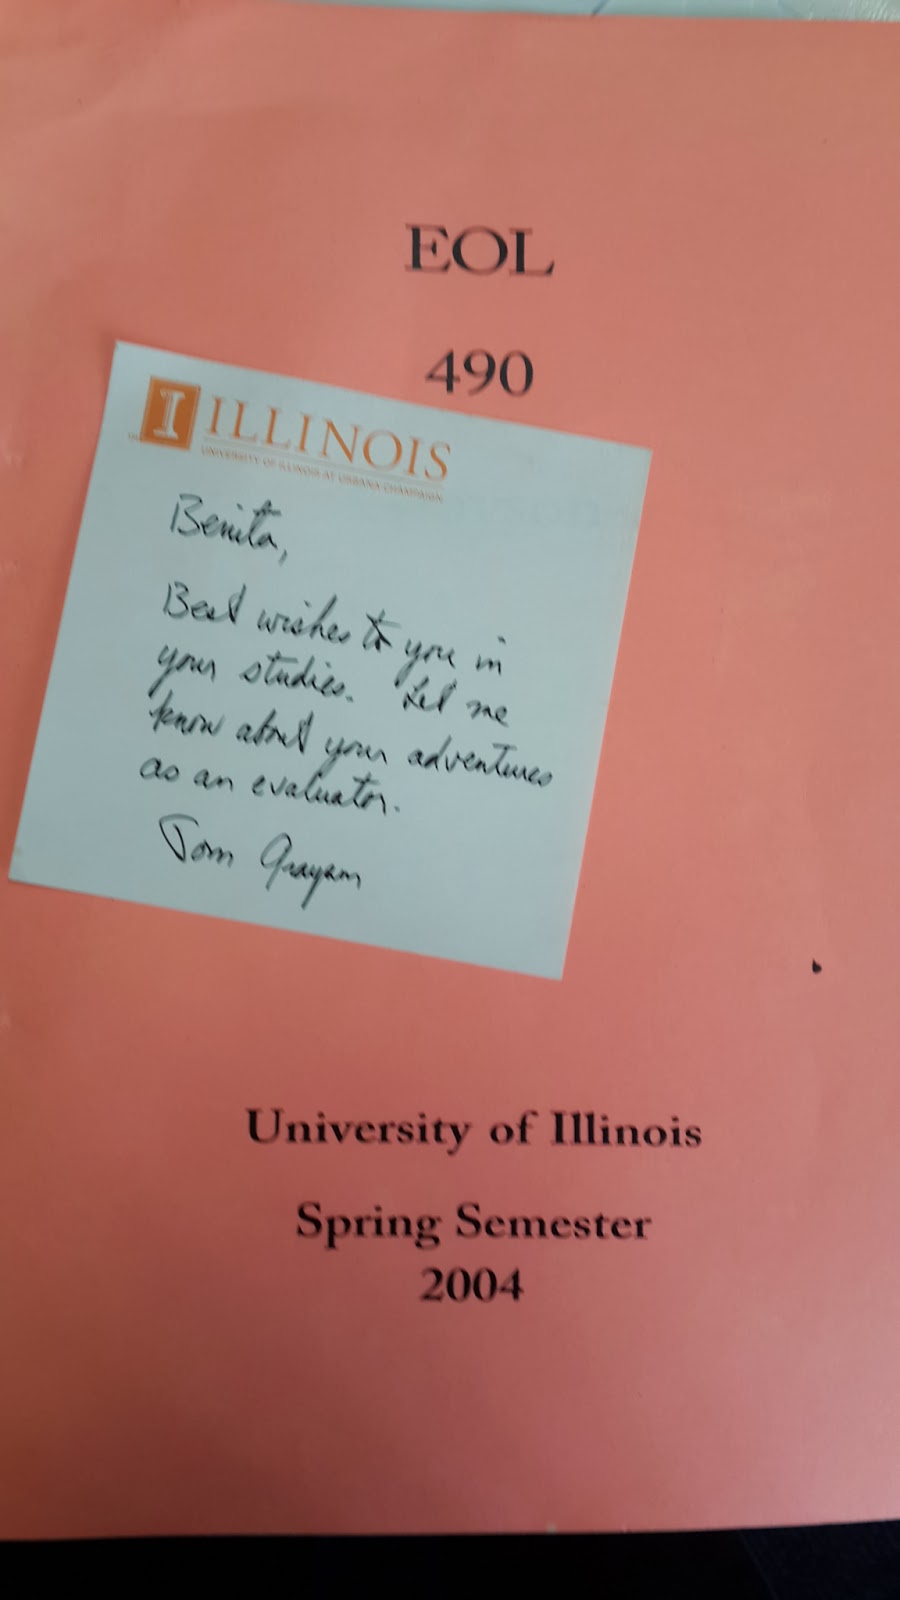
Its after reading something that Tom Grayson (from the University of Illinois at Urbana-Champaign) wrote in a journal article about teaching evaluation, that I decided to email him. I asked him for some reading material that will give me a good basis in Evaluation. He responded by sending me a package of course reading materials via post… This was such an unexpected gesture of goodwill. Above is a little handwritten note that he sent with the material.
 
So Tom, thanks a lot. And this is me letting you know about my adventures in evaluation!

Reflection: I decided to become an evaluator in May of 2002

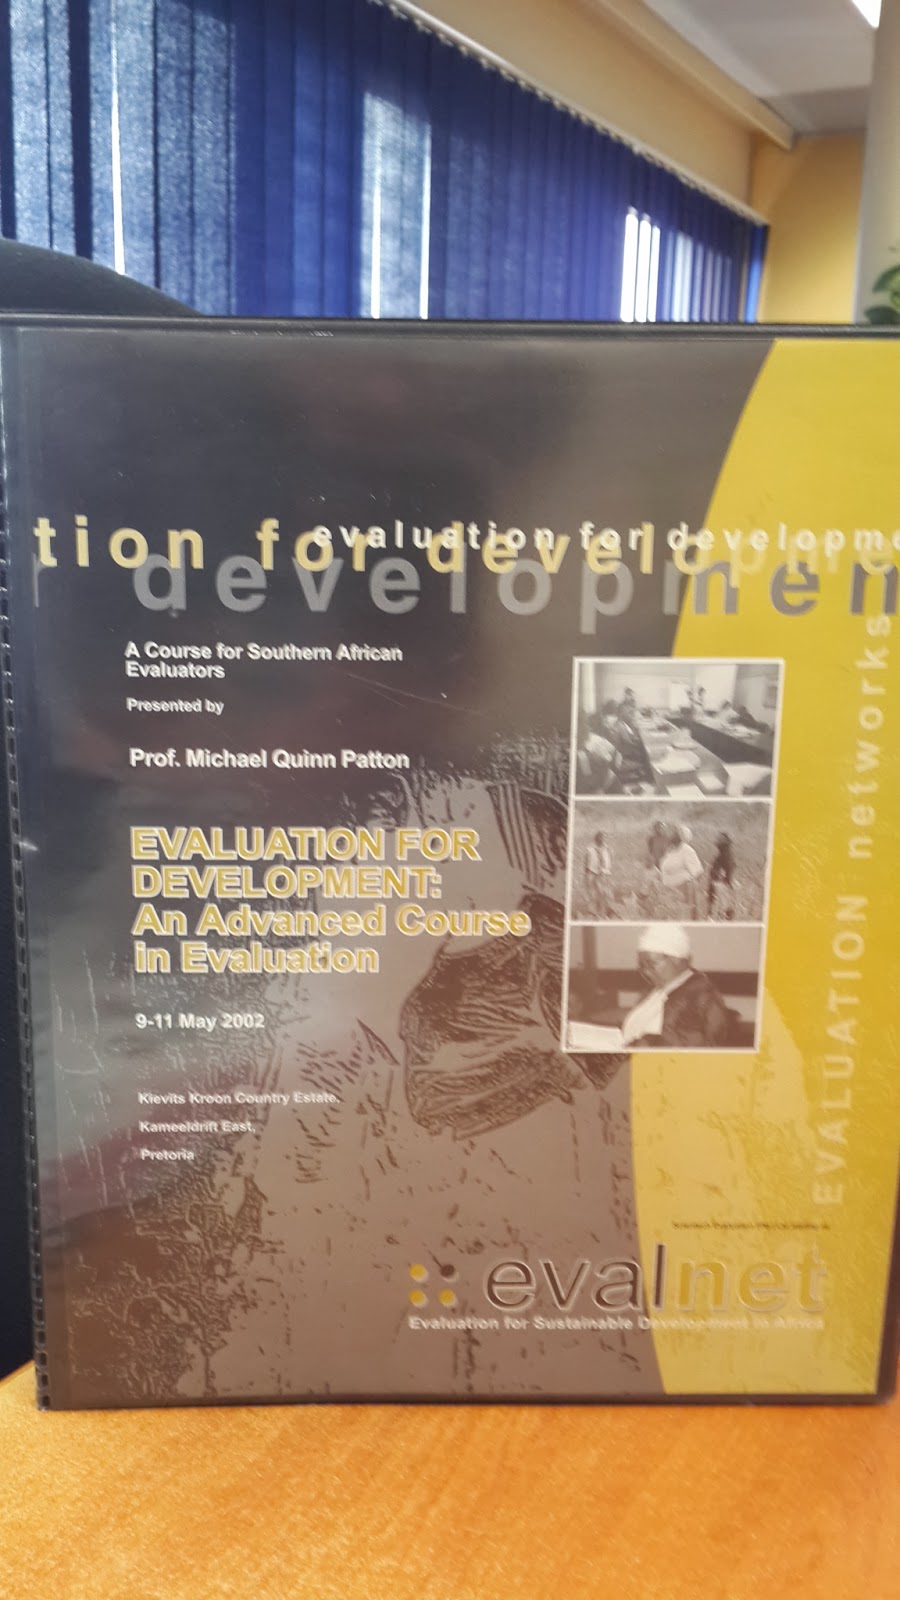
As I was packing up the FeedbackRA office, I found a few files that I needed to clear out. This one is special, because it was during this workshop that I chose to relate to the identity of Evaluator.
It is a file for a workshop titled “Evaluation for Development: An Advanced Course in Evaluation”. It was presented by Michael Quinn Patton in Pretoria in 2002, and it was arranged by Zenda Ofir from Evalnet.
  
My academic training in the field of Research Psychology meant that I was comfortable with research methods, but I also wanted to be involved in Development…  I didn’t have a good idea of what I wanted to do with the research skills, and frankly, before joining Khulisa I had never heard of evaluation as a career option. The Community Psychology training I did at Honours and Masters level resonated deeply with me. Previously I had thought that I wanted to be a project officer at an NGO or international development organization, but I also realised that I like doing the research. I think that after about a year’s working experience I started to think of myself as a researcher. 
I will forever be grateful for the experience I got at Khulisa Management Services, and the fact that Jennifer Bisgard let me go to this workshop in 2002. Thanks to Zenda Ofir for arranging it, and thanks for Michael Quinn Patton for preaching/teaching so convincingly.

So long FeedbackRA, and thanks for all the fish!

Below is a picture of myself, my business partner, and our spouses on the day we moved into our offices in April 2006. And then a picture of the people in the Feedback Offices today, for one last time (Terence is away in Rwanda on a jobbie).

Today is a little bit of a sad day for me. We’re packing up the FeedbackRA offices which have been the place where I practiced my profession for the past eight years. I’m starting at my new offices tomorrow, and it means that my relationship with FeedbackRA is one step closer to dissolving further.

The timeline:
I started the business in 2002 together with two colleagues. Our first job was a survey we did for MTN. Our first evaluation job was for the Gauteng Education Development Trust.

In 2004 I quit my fulltime job to earn my own salary at Feedback. In this year we did a nice piece of research for the Department of Science and Technology, and started expanding our CSI business base.

In 2006 we graduated to proper offices.  We appointed our first employees and embarked on a range of projects that just saw the business  grow – in terms of its focus, our skill and the turnover.

 In 2007 and 2008 we did a strategic piece of research on JIPSA, and I got to interview ministers and captains of industry. In this time I was also involved with setting up SAMEA and in 2009 I started to contribute to AFREA too.

In September 2009 I took a step back to reflect on the important things in my life. Up and ‘til 2009 I managed the business and business finances, and delivered as a key consultant, while keeping an eye on things at SAMEA and AFREA. I just couldn’t do it all any longer.

In 2010 I scaled down on my work and volunteer responsibilities, and we got Daleen involved to help us run the business. My life was much simpler after that… but it was still tough, because the business kept on growing. I did some lovely work with colleagues from Stellenbosch on a Public expenditure tracking survey… and I learnt so much from being the “junior” on the team.

In 2010 we started negotiations with a range of other high-profile consultants to see if they would like to join as business partners. We worked together on a few projects, we had a strategic planning session… everything looked good.  Our business was expanding and we decided to take up more office space. We started two big contracts which allowed us the scope to do some longer term planning, but it also opened the business up to risk… because things did not always go according to plan.

In 2011 an advertisement for the only other job I ever thought I’d consider, crossed my desk. I decided to apply, and let my business partners know. We let the conversation with the other potential business partners cool down a bit. After 6 months in limbo, I found out that I did not get the other job, but it took only 1 month for me to realise that what I’ve gained at Feedback was significant enough for me to call it quits. The stress of managing a business and a full consulting plate was just too much. I took on one too many assignments – because a colleague that I respect a lot twisted my arm.  This had bad consequences for me as an individual. I didn’t do my best work any longer.  I wanted to do things well again… I wanted to focus on things that I could do well, instead of just taking on jobs to make sure cash flow was sorted. A week after my decision, I found out I was going to be a mom. So suddenly I had another reason to reevaluate my priorities.

I sold my interest in Feedback RA in September 2011, and handed over all management responsibility to my colleagues. I worked as a consultant at FeedbackRA until April 2012, and then returned on a part time basis on selected assignments from October 2012. In this time I realised that I really preferred working on Education issues, and the area of ICT for Education became my core focus.

I continued working at Feedback until October 2013, when I decided to start my own consultancy again – Benita Williams Evaluation Consultants. I still helped out with some of the FeedbackRA work, and by January 2014 I was able to take over some of the FeedbackRA staff.

Tomorrow will be the first day in our new offices, which is quite exciting. But there is a  side of me that is really sad and nostalgic for what was.

Thanks colleagues, collaborators, clients and friends. Thanks to my family. It is the end of an era, so…. “So long, and thanks for all the fish!”

Making a serious point… With a Mini-mouse Ribbon on my head

The ICT4RED project released this video of team members sharing how their lives were affected by the project (Follow Mobilina Cofimvaba‘s channel on Youtube for more videos about the project). In the video I share how I was motivated to use Twitter as professional learning tool.

For some reason the M&E people got associated with being mice. Maybe because we snoop around everywhere, maybe because we need big ears to listen, maybe because our job involves us being quiet… (Though I haven’t managed being quiet yet…) So for the tablet fun day on 2 November I donned a mini-mouse ribbon to man the M&E Mouse station.

Twitter as professional development tool

I was one of the earlyish adopters of Twitter. In 2008 however, I couldn’t see the point of maintaining a Facebook profile and a Twitter profile just to keep my friends and family updated about goings on. Very few of my friends were on Twitter so it was hard finding a reason to check in… Since I wasn’t into the Kardashians’ and Hiltons’ business,Twitter just did not have what I wanted. So my account became dormant.
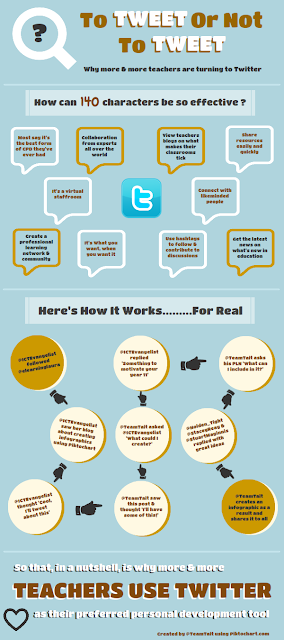
In 2013 however, I started evaluating a tech for education initiative. Maggie Verster @maggiev showed me how teachers could use Twitter to develop their own personal learning network. Here  is a nice summary. Finally I could see a use for it.
Now Twitter is my professional social networking tool and Facebook is kept for personal networking. I use Twitter in a general sense
*To find newspaper articles I’m interested in. All the big newspapers post links to top stories to twitter which links to their online sites. Mail and Guardian is one publication that I follow at @mailandguardian
*To check traffic between johannesburg and pretoria on the @itrafficGP handle whenever I tavel
*To get a sense of public sentiment on major news stories #RipNelsonMandela was quick to trend once the news broke. I was also amused by the #underdog story
But the real value is in the professional applications of Twitter. It helps me to find relevant content and people and to share my own content and interests with others. I have used Twitter:
*To find interesting blog posts by other evaluators and development players @BetterEval for example post snippets from their blog onto Twitter. So does the @Worldbank, @DGMurrayTrust  @Tshikululu and @RockefellerFDN
*To find information about education and evaluation events. This year I followed the American Evaluation Association’s #eval13 conference from afar, and Bridge @BridgeProjectSA is very good with keeping a running commentary going on twitter for their education events
*To publicise my own blog content to potential users. My handle @benitaW sometimes carry links to www.mandeblog.blogspot.com
*To share interesting reading with other people. Twitter is probably not the best content curation tool, but its easy to find an article you’ve read and shared if you need to. It also helps to show other colleagues what your thinking is influenced by. They may suggest content on other or similar viewpoints… in essence allowing a little debate to take place, and extending your horizons a bit
 *To express opinion about published content. @DBE_SA ocassionally puts out very good and very nonsensical content that I just *have to* respond to.
*To maintain a back channel of communication at events. At the #SAMEA 2013 conference there was quite a vibe going on Twitter between persons attending the conference (@aidencholes @SouthernHemis @mmarais). At the #ICT4RED #tabletfunday I helped someone find their lost cellphone via twitter.
*To live tweet events. I kept up a running commentary of the #Samea 2013 conference sessions I attended. This helped me to keep a record of important points, and provided other members of the international evaluation community (e.g. @txtPablo @guijti @patriciajrogers) with a sense of important news.
*To find other like minded professionals. I started following @aidencholes because he is linked to the narrative lab and they also look at narrative methods… the topic of a recent conference paper. At the Samea conference we finally met face to face and we already had lots to talk about. @louisevanrhyn also works with schools
*To figure out who the movers and shakers are in other fields that I’m interested in. Dave Snowden @snowded is a systems thinker whose work I started following as a result of Twitter.
So if you are ready to take the plunge, here is a ten day twitter challenge that Sean Cole @seanhcole created for South African teachers. It applies well to evaluators too. Give it a bash!

Evaluators (#eval #evaluation) that I follow:
@patriciajrogers
@clysy
@John_Gargani
@ejanedavidson
@AnnKEmery
@txtPablo
@chiyanlam
@evalu8r
@EvaluationMaven
@sukist
@guijti

Evaluators from South Africa
@Duganf
@SouthernHemis
@aidencholes
@mmarais
@alfredeinstein
@developmentWorx

Orgnizations involved in Evaluation
@EvalPartners
@aeaweb
@BetterEval
@CDIwageningenUR
@JPAL_Global
@gatesfoundation
@Worldbank
@DGMurrayTrust
@RockefellerFDN

ICT4RED Learning Workshop

I’m contributing to the evaluation of the ICT4RED (Information Communication Technology for Rural Education Development) initiative – A very ambitious project that rolls out teacher professional development to enable teachers and learners to use 21st century methods and tablet computers in rural schools in Cofimvaba in the Eastern Cape. More information about the project here and here.

We decided to use a developmental evaluation approach – I’m practically embedded in the organization that’s responsible for implementing the project. I’m finding that this is a wonderful opportunity to influence what happens… But because this project is so different from the many failed technology projects that I’ve evaluated before, I sometimes wonder whether I am “objective” enough to add actual value.

We organised the M&E team’s work into four categories –

  • Monitoring – Measuring progress made on outputs, facilitating ocassional debrief meetings with team members, reflecting on abundant data from various social media streams and participating in weekly project management meetings
  • Evaluation – Measuring the success after various implementation phases – incorporating some self-evaluation workshops, and other more standard evaluation measures including ethnograpic descriptions, baseline and follow up surveys, and a small scale RCT and tracer study
  • Learning – Asking team members to ocassionally reflect on what theyve learnt – from successes or failures
  • Model Development – Developing a modular theory of action underpinned by a theory of change that can be used to support scale up and replication. 

 Yesterday we held a “learning workshop” where team members had to reflect on what they’ve learnt.
Our first template for the learning briefs asked for the following information:

Project Name
    Give the project name here
Submitted by
    Give the name and component name
Date
    Give the date on which you submit the learning brief
What was the learning?
    Please describe the learning that occurred
Learning brief type
    Indicate which of the following three is applicable and provide a short description
    •    Learning from failure during implementation
    •    Learning from implementation success
    •    Learning from review of previous research and practice (i.e. not practically tested yet)
The Context
    Say something about the context of the learning / project context, add relevant pictures if they are available
Why is this learning important?
    Please describe why this learning is important
Evidence Base
    Please indicate what the evidence base is for this learning brief, if possible, provide references that may help the reader track down the evidence base.
Recommendations for future similar projects
    Please provide your recommendations in a list wise form. If possible add pictures, graphs or diagrams
Recommendations that should be taken into account by the current project
    Please indicate which of the above recommendations should be taken into account for the current project

My colleagues, who are great at packaging information, asked that we focus the learning presentations on
& What we designed
? What we learnt
# What we’re doing now
! Advice for Policy and practice

This made for quite nice presentations. We’ll probably adapt our learning brief templates accordingly.

Finding Data for Evaluations

Finding existing Government Data is often a huge problem for evaluators who are designing evaluations in Africa. We don’t always know what is available, but even if we know, it is usually very hard to get hold of the relevant data.

The first eResearch Africa conference took place from 06-10 October 2013 in Cape Town and was hosted by the Association of South African University Directors of Information Technology

Presentations from the conference are available here.

What I do find exciting is that quite a few of the presentations spoke about making government data available. I learnt about the Accelerated Data Programme, in a presentation by Lynn Woolfrey, and was also excited to see the Human Science Research Council and UCT share something about their intiatives to make data available.

One of my new favourite productivity tools

I’m currently working with some smart people who aren’t shy to self identify as geeks and nerds. One of them introduced me to a tool that has now become indispensable at work.

Trello.com is an electronic version of the old fashioned whiteboard in the office. Except its much more portable, it integrates with dropbox and it sends you email reminders of tasks due. And its free! I use it to:

* Manage task lists with evaluation teams  – task cards move across three lists: to do, doing, done.
* Keep track of data flows  – each type of data gets a card that moves across lists like: to administer, administering, received back, initial quality control done, to capturing, capturing done, data quality control done, added to master database
* I imagine it can work pretty well for keeping track of action points between meetings.

Its not quite as cute as this lego calendar that syncs with google calendar, but it comes close. Here is a description of trello by Mashable.

African Evaluation Journal

Africa finally has its own evaluation journal. The first issue has been compiled, and will be released soon. Congratulations to AFREA and SAMEA for your work on this!

The African Evaluation Journal will publish high quality peer-reviewed articles of merit on any subject related to evaluation, and provide targeted information of professional interest to members of AfrEA and its national associations and evaluators across the globe. This will encompass the following aims:

  • To build a high quality, useful body of evaluation knowledge for development.
  • To develop a culture of peer-reviewed publication in African evaluation.
  • To stimulate Africa-oriented knowledge networks and collaborative efforts.
  • To strengthen the African voice in evaluation.

Editor-in-Chief: Mark Abrahams, Division for Lifelong Learning,University of the Western Cape, South Africa
Associate Editor: Guy Blaise Nkamleu, Principal Evaluator, African Development Bank, Tunisia

SAMEA Conference 16 – 20 September 2013

I can’t wait. I am looking forward to this week’s SAMEA conference.

Good luck to Babette and team. I’m sure the blood sweat and tears you’ve invested in this conference will pay off.

I’m involved in a paper session on Evaluating ICT for Education programmes, and I’ll also be sharing something about a little tool I call the “Impact Story Template”. 

An Excellent Read – Application of Systems thinking

Just yesterday I was chatting with a lady about the reasons that would compell someone to do serious crimes, and today I found this truly engaging read on the topic. I think it is an excellent example of how systems thinking can be applied to solving Wicked problems. From the pwc website:
 
 
A case study in developing a systemic model to transform a fragile social system
What it looks like when it's fixed

What it looks like when it’s fixed The more we study the major challenges of our time – such as poverty, crime, unemployment, health and the environment – the more we realise that conventional solutions are failing to create the impact they had in the past.
What it looks like when it’s fixed provides a case study in the development of a different approach that offers new hope in tackling the most daunting challenges facing our society and institutions.
This work draws on the growing body of systems and design thinking knowledge to address the wicked social problems facing our society. What it looks like when it’s fixed offers a new holistic way of understanding complex social systems, building stakeholder cohesion and designing solutions that will work in our era.

About the author Dr Barbara Holtmann uses systems and design thinking to facilitate understanding and insight among key stakeholders dealing with fragile social systems across the world. She has worked in business, government and most recently at the CSIR. Barbara is Vice President of the International Centre for the Prevention of Crime and serves on the boards of Women in Cities International and the Open Society Foundation for South Africa. She was the recipient of the Ann van Dyk Applied Research Award in 2010.

Survey of ICT in Education in Africa

This from the FOSSA website (Free and Open Source Software Africa)

How are ICTs currently being used in the education sector in Africa, and what are the strategies and policies related to this use?

infoDev is helped to coordinate a comprehensive study surveying the current landscape of ICT in education initiatives in Africa, and was interested in collaborating with partner organizations who wished to be involved in this work.
Key questions:
– How are ICTs currently being used in the education sector in Africa, and what are the strategies and policies related to this use?
– What are the common challenges and constraints faced by African countries in this area?
– What is actually happening on the ground, and to what extent are donors involved?

You can download the reports Free and Open Source Software Africa’s Reports and White Papers page  A new survey is forthcoming 

How to specify your needs if you require a case study

A client is interested in contracting us to write up a case study for one of their programmes, but they don’t really know which information will be necessary. Since there are no terms of reference yet for the case study, I suggested that the client clarifies the following, in order for us to be able to assess the level of effort required.

1. What will the case study be used for? (To document lessons learnt, to help with marketing, to document evidence of a successful initiative)
2. What is the final product that you have in mind, and how long does it need to be? (A written report, or a presentation, or a glossy publication)
3. Who will be reading the Case Study?
4. How much background documents do you have available? (Project descriptions, evaluation findings, participation data, survey data)
5. What kind of additional data collection will be necessary? (Interviews, photo’s, site observations)
6. Would you want to meet with the evaluation team before the assignment starts, and after it is completed? 

I came across this useful little guide on how to use Case Studies to do Program Evaluation.It helps one to assess whether a case study should be used, and how to do it.

Edith D. Balbach, Tufts University
March 1999
Copyright © 1999 California Department of Health Services

Developed by the Stanford Center for Research in Disease Prevention

The Better Evaluation page on Case Studies can be found here.

Simple Evaluation Tools

I’m starting a project soon where I will have to develop and compile really simple Evaluation materials for organizations that may not have a lot of expertise to do M&E. Here is one of the really simple but striking tools that I came across at the community sustainability engagement evaluation toolbox

Getting the right tools into people’s hands is of course only part of the solution to making sure evaluation at grass roots improve. Sometimes it is less the case that people don’t know how to do M&E, and more that they are spread too thin to also do M&E….

MOOCs that Evaluators might consider


In a previous post I shared some ideas about Massive Open Online Courses (MOOCs). I came across a listing of free courses offered by some prominent US Universities via online platforms. The full list with more than 200 courses is here:
The site uses the following key to provide information on the certification offered through these courses.
Free Courses Credential Key
CC = Certificate of Completion
SA  = Statement of Accomplishment
CM = Certificate of Mastery
C-VA = Certificate, with Varied Levels of Accomplishment
NI – No Information About Certificate Available
NC = No Certificate
What caught my eye is the fact that there are quite a few courses listed that might be interesting to evaluators looking to improve their stats capacity.
Introduction to Statistics (NI) – UC Berkeley on edX – January 30 (TBD weeks)
Probability and Statistics (NC) – Carnegie Mellon
Statistical Reasoning (NC) – Carnegie Mellon
A few of the courses that started recently that also looks interesting include:
Data Analysis (NI) – Johns Hopkins on Coursera – January 22 (8 weeks)
Introduction to Databases (SA) – Stanford on Class2Go – January 15 (9 weeks)
Introduction to Infographics and Data Visualization (CC) Knight Center at UT-Austin – January 12 (6 weeks)
Social Network Analysis (CC) – University of Michigan on Coursera – January 28 (9 weeks)
Looks like we will have to keep a closer eye on this type of information! 
 

Reflections from various Evaluations of ICT projects

After doing a few evaluations of ICT projects implemented in schools, I reflected on some of the lessons we’ve learnt throughout. Its not an exhaustive list, and certainly a lot of it is common sense, but somehow it is the common sense things that people do not always plan for.

Some of the key questions that I would like to see answered in evaluations of these type of initiatives include:

›Is the content relevant? (Content review)
›Is the content user friendly for the intended users (Heuristics Evaluation)
›Was it implemented at the requisite “dosage” level for it to possibly work? (Fidelity monitoring)
›Can it effect change? (Experimental design)
›At what cost (to participants and donors) (Cost analysis)
›Then only, can you start to answer: Did it work (Quasi-experimental design)
›Does it work better than “something else” (comparative analysis), or how does it work with “something else”

Online Tertiary Education

Thomas Friedman wrote an article in the NYTimes about the “revolution” in Universities .
Revolution Hits the Universities
Nothing has more potential to let us reimagine higher education than massive open online course, or MOOC, platforms.

I think this is a wonderful development and one that I have eagerly awaited. Having access to great education opportunities without having to travel will help me become a better evaluator. Already I visit www.betterevaluation.org; www.mymande.org and www.statistics.com for some of my personal capacity development needs. I might pursue formal credentialing some time in the future via this route.

I acknowledge that this move to online training is  a juggernaut that will not be stopped. I just wonder what the systemic effects will be? How much “blood” will be shed in this “revolution” before the necessary checks and balances will be implemented? As with all revolutions, its not going to have good effects for everybody!

One category of “deaths” that I foresee is that of the average university professor as a teacher.

 If everyone does a course with the “best” prof. in the world, the second and third best profs won’t have teaching jobs anymore. The effects might be that we could end up with a dangerously monolithic way of thinking, with all kinds of implications for how we define problems, seek answers and develop the body of scientific knowledge. On the other hand, a common language may finally emerge, allowing more people to stand on the shoulders of giants to reach for diverse solutions in their diverse contexts.

Back when TV was introduced we had no idea what impact it will eventually have. I think we are standing in that exact same spot again…

A new start for 2013

I recently took on a long term development project that involves a certain baby with beautiful blue eyes, so the blogging had to move to the back burner. But here is a fresh contribution for this month.


As part of the M&E I do for educational programmes, I frequently suggest to clients that they not only consider the question: “Did the project produce the anticipated gains?” but that they also answer the question “Was the project implemented as planned? This is because sub-optimal implementation is, in my experience, almost always to blame for negative outcomes of the type of initiatives tried out in education. 
Consider the example of a project which aims to roll out extra computer lessons in Maths and Science in order to improve learner test scores in Maths and Science.  We not only do pre-and post-testing of the learner test scores in the participating schools, but we also track how many hours of exposure the kids got, what content they covered, how they reacted to the content, etc. And we attend the project progress meetings where the project implementer reflects on the implementation of the project.  Where we eventually don’t see the kind of learning gains anticipated, we are then able to pinpoint what went “wrong” with the implementation – frequently we can predict what the outcome will be based on what we know from the implementations. This manual on implementation research outlines a more systematic approach to figuring out how best to implement an initiative – written with the health sector in mind.  
Of course implementation success and the final outcomes of the project is only worth investigating for interventions where there is some evidence that the kind of intended changes are possible. If there is no evidence of this kind, we sometimes conduct a field trial with a limited number of kids, on limited content, over a short period of time in an implementation context similar to the one designed for the bigger project.  This helps us to answer the question “Under ideal circumstances, can the initiative make a difference in test scores?

What a client chooses to include in an evaluation is always up to them, but let this be a cautionary tale: A client recently declined to include a monitoring / evaluation component that considered programme fidelity, on the basis that it would make the evaluation too expensive. When we started collecting post-test data for the evaluation, we discovered a huge discrepancy between what happened on the ground, and what was initially planned–  Leaving the donor, the evaluation team and the implementing agency with a situation that has progressed too far to fix easily.  Perhaps if there was better internal monitoring this situation could have been prevented. But involving the evaluators in some monitoring would have definitely helped too!

Telephone Equipment for Evaluators

From time-to-time my consultancy conducts telephonic surveys and teleconferences as part of our normal evaluation work. I have been extremely impressed with the two South African companies that we bought our equipment from, and I want to share their contact details with you.

To give you an indication of why I was impressed – Within five minutes of contacting Phonatics about headsets, I had a quote, and it was delivered on the same day I paid for the equipment.

After losing our conference phone’s manual, we emailed the general info@ email address on the Konftel website – 10 minutes later we received an emailed manual and someone called us to ensure that we got what we were looking for.

Knowledge Management Toolkit

Knowledge Management for Health put this KM toolkit together that might be useful for Health Practitioners and those in the M&E field who are also concerned with ensuring that the “learning” from our evaluations do not get lost.

It will help those who are:

  • Looking for a primer on KM
  • Developing a KM strategy
  • Interested in knowledge sharing strategies
  • Interested in how to find knowledge and the best ways to organize it
  • Interested in tools to create new insights and knowledge
  • Interested in tools for adapting knowledge to inform and improve policy and program decision-making
  • Evaluating KM activities or programmes

Information IS (could be) beautiful!

Ooh, ooh! This is so beautiful!  Information is beautiful is David McCandless’ blog dedicated to beautifully executed infographics.
Here is an example they picked up from the OECD better life Initiative done by Moritz Stefaner and co.

The length of the “flower petals” indicates the rating of the countries on indicators such as Housing, Income, Jobs, Community, Education, Environment, Governance, Health, Insurance, Life Satisfaction, Safety and Work Life Balance. For information about how they measure these, check out the oecd betterlife website

SPSS, PASW and PSPP

When IBM acquired SPSS (Statistical Package for the Social Sciences) in 2009, they changed the program’s name to PASW (Predictive Analytics SoftWare), but with the next version it became SPSS again. Today I read about PSPP and thought “Oh goodness, did they change the name again?” Turns out that PSPP is an open source verion of SPSS and it allows you to work in a very similar way to SPSS. This is what their website says:

PSPP is a program for statistical analysis of sampled data. It is particularly suited to the analysis and manipulation of very large data sets. In addition to statistical hypothesis tests such as t-tests, analysis of variance and non-parametric tests, PSPP can also perform linear regression and is a very powerful tool for recoding and sorting of data and for calculating metrics such as skewness and kurtosis.PSPP is designed as a Free replacement for SPSS. That is to say, it behaves as experienced SPSS users would expect, and their system files and syntax files can be used in PSPP with little or no modification, and will produce similar results.

PSPP supports numeric variables and string variables up to 32767 bytes long. Variable names may be up to 255 bytes in length. There are no artificial limits on the number of variables or cases. In a few instances, the default behaviour of PSPP differs where the developers believe enhancements are desirable or it makes sense to do so, but this can be overridden by the user if desired.

I will give it a test drive an let you know what I think! 

PS. to all the “pointy-heads“: In the right margin of my blog you will find a link to a repository of SPSS sample syntax!

Using Graphs in M&E

(The pic above is from Edward Tufte’s website – Ive always been a fan of his work on data visualization too!)

One of my colleagues found a really simple yet detailed explanation about uses of graphs. It is written my Joseph Kelly and it is focused on financial data, but still applicable to evaluators who work with quants.


Using Graphs and Visuals
to Present Financial Information

Joseph T. Kelley

This is from the intro:

We will focus on seven widely-available graphs that are easily produced by most any electronic spreadsheet. They are column graphs, bar graphs, line graphs, area graphs, pie graphs, scatter graphs, and combination graphs. Unfortunately there is no consistency in definitions for basic graphs. One writer’s bar graph is another’s column graph, etc. For clarity we will define each as we introduce them. Traditionally we report data in written form, usually by numbers arranged in tables. A properly prepared graph can report data in a visual form. Seeing a picture of data can help managers deal with the problem of too much data and too little information. Whether the need is to inform or to persuade, graphs are an efficient way to communicate because they can
• illustrate trends not obvious in a table
• make conclusions more striking
• insure maximum impact.

Graphs can be a great help not only in the presentation of information but in the analysis of data as well. This article will focus on their use in presentations to the various audiences with which the finance analyst or manager must communicate.

Enjoy!

Recall Bias in Survey Design

I’m working on a survey which intends to measure whether a person’s participation in a fellowship increased their research productivity (i.e. number of publications, new technologies developed and patented). At baseline the person is asked to report about their publications in the two years preceding the measurement. After two years of participation in the programme, the person is asked to reflect on their publications record since the start of the programme.

Besides the fact that publications usually have a long lead time, a recall bias may also be at play. The European Health Risk Monitoring Project explains response shift bias as follow:

Recent happenings are easier to remember but when a person is asked to recall events from the past, accuracy of the recall gets worse while time span expands. Long recall periods may have a telescoping effect on the responses. This means that events further in past are telescoped into the time frame of the question.

In my example, if the question asks if a person published a journal article in the past 2 years, the respondent might place the journal article which was published 2.5 years ago into the time frame of 2 years. Those people who do not publish regularly might be better able to provide accurate information. Those who publish frequently could potentially check their facts, but they are unlikely to do so if the survey is not seen as sufficiently important.

The EHRM recommends the following strategies for trying to address this type of bias: 

The process of recall of events from the past can be helped by questionnaire design and process of interview. The order of questions in the questionnaire can help respondents to recall events from the past. Also giving some landmarks (holidays, known festivals etc.) can help to remember when some events happened.  Also, use of a calendar may help a respondent to set events into the correct time frame.

http://lifehacker.com/5821070/visually-is-an-infographics-hub-with-tools-to-create-your-own

http://lifehacker.com/5821070/visually-is-an-infographics-hub-with-tools-to-create-your-own

Visual.ly Is An Infographics Hub With Tools to Create Your Own
New service Visual.ly features over 2000 infographics on a range of topics from economics to history. The site also has tools to help people interested in creating their own infographics get started, build them, and share them with a community of fans and companies like CNN, National Geographic, and more.
The infographics already available at Visual.ly span topics as complicated as global arms sales to seemingly simple (but not really) topics like the overall financial impact of a snowstorm. There are plenty to see, but if you’re interested in making your own, the Visual.ly Labs give you the tools to build your own, starting from templates.

For example, one of the templates allows you to compare yourself with another Twitter user, or with a Twitter celebrity. The site will add additional templates soon to help more data-driven groups present their research in interesting ways. If you’re a fan of infographics, it’s worth a look.

http://visual.ly/category/education

Resource: Reproductive Health Indicators Database

This announcement about a very useful resource came through on SAMEA talk earlier this week.
  

MEASURE Evaluation Population and Reproductive Health (PRH) project launches new Family Planning/Reproductive Health Indicators Database
The Family Planning/Reproductive Health Database is an updated version of the popular two-volume Compendium of Indicators for Evaluating Reproductive Health Programs (MEASURE Evaluation, 2002).
New features include:
    * a menu of the most widely used indicators for evaluating family planning/reproductive health (FP/RH) programs in developing countries
    * 35 technical areas with over 420 key FP/RH indicators, including definitions, data requirements, data sources, purposes and issues
    * links to more than 120 Web sites and documents containing additional FP/RH indicators    
This comprehensive database aims to increase the monitoring and evaluation capacity, skills and knowledge of those who plan, implement, monitor and evaluate FP/RH programs worldwide. The database is dynamic in nature, allowing indicators and narratives to be revised as research advances and programmatic priorities adapt to changing environments.


South African Consumer Databases

Eighty20 is a neat consultancy that works with various databases available in South Africa to provide businesses, marketers, policy makers and developmental organisations with data-informed insights. I am subscribed to their “fact a day” service, which provides all sorts of interesting statistical trivia, but also exposes the various databases available in South Africa.

Today, their email carried an announcement about a new service called XtracT beta which apparently allows you to “crosstab anything against anything”

They say:

XtracT is the easiest way to access consumer information databases in South Africa. Just choose what interests you (demographics, psychographics, products, media, etc), and a filter if you wish, and a flexible cross-tabulation will appear.

Details about how it works can be found on the XtracT website, and they even have a short tutorial video to explain it.

In case you wondered about their logo… This t-shirt might give you a hint!

Evaluation Basics 101 – Involve the users in the design of your instruments

Early this week, I got back from my work-related travel to Kenya, but then I ran straight into two full days of training. We planned to train the staff of a client on a new observation protocol that we developed for them to use. The new tool was based on a previous tool they had used. Before finalising the tool, we took time to discuss the tool with a small group of the staff and checked that they thought it could work. We thought the training would go well.

Drum roll…It didn’t. On a scale of 0 to going well, we scored a minus 10. It felt like I had a little riot on hand when I started with “This is the new tool that we would like you to use”.

Thinking about it – I should have crashed and burned in the most spectacular way. Instead, I took a moment with myself, planted a slap on my forehead, uttered a very guttural “Duh!” and mentally paged through “Evaluation Basics 101 – kindergarten version”. Then I smiled, sighed, and cancelled the afternoon’s training agenda. I replaced it with an activity that I introduced as: “This is the tool that we would like to workshop with you so that we can make sure that you are happy with it before you start to use it”.

Some tips if ever you plan to implement a new tool (even if it is just slightly adjusted) in an organization:
1) Get everybody who will use the tool, to participate in the designing of the tool
2) Do not think that an adjustment to an already existing tool exempts you from facilitating the participatory process
3) Do not discuss the tool with only a small group from the eventual user-base. Not only will the other users who weren’t consulted riot, even the ones that had their say in the small group are likely to voice their unhappiness.

When we were done, the tool looked about 80% the same as it did at the start, and they did not complain about its length, its choice of rating scale or the underlying philosophy again.

Lesson learnt. (For the second time!)

Weekly Funny: “A dog’s brain is probably as effective…


as the most sophisticated statistical software on the market…” Says dog house diaries.

  (Click for larger pic)

Close observations of “Spikkels” and “Trompie”, my resident English Springer Spaniels, provide anecdotal evidence to support this theory. The Spaniels will have to try their tricks on the other “boss person” in our household for a few days. I’m off to East-Africa for a bit of work.

ANA Results – 2011

 I have previously blogged about the implications of the Department of Basic Education’s Annual National Assessments (ANAs) for educational evaluations. Yesterday, the grade 3, 6, and 9 results were released. The detailed report can be found on the FEDSAS website.

Add caption

Some highlights from the  Statement on the Release of the Annual National Assessments Results for 2011 by Mrs Angie Motshekga, Minister of Basic Education, Union Buildings: 28 June 2011

“Towards a delivery-driven and quality education system”
Thank you for coming to this media briefing on the results of the Annual National Assessments (ANA) for 2011. These tests were written in February 2011 in the context of our concerted efforts to deliver an improved quality of basic education.
It was our intention to release the results on 29 April 2011, at the start of the new financial year, so that we could give ourselves, provinces, districts and schools ample time to analyse them carefully and take remedial steps as and where necessary. Preparing for this was a mammoth task and there were inevitable delays.
Background
We have taken an unprecedented step in the history of South Africa to test, for the very first time, nearly 6 million children on their literacy and numeracy skills in tests that have been set nationally.
This is a huge undertaking but one that is absolutely necessary to ensure we can assess what needs to be done in order to ascertain that all our learners fulfil their academic and human potential.
ANA results for 2011 inform us of many things, but in particular, that the education sector at all levels needs to focus even more on its core business – quality learning and teaching.
We’re conscious of the formidable challenges facing us. The TIMMS and PIRLS international assessments over the past decade have pointed to difficulties with the quality of literacy and numeracy in our schools.
Our own systemic assessments in 2001 and 2004 have revealed low levels of literacy and numeracy in primary schools.
The Southern and Eastern African Consortium for Monitoring Education Quality (SACMEQ) results of 2007 have shown some improvements in reading since 2003, but not in maths.
This is worrying precisely because the critical skills of literacy and numeracy are fundamental to further education and achievement in the worlds of both education and work. Many of our learners lack proper foundations in literacy and numeracy and so they struggle to progress in the system and into post-school education and training.
This is unacceptable for a nation whose democratic promise included that of education and skills development, particularly in a global world that celebrates the knowledge society and places a premium on the ability to work skilfully with words, images and numbers.
Historically, as a country and an education system, we have relied on measuring the performance of learners at the end of schooling, after twelve years. This does not allow us to comprehend deeply enough what goes on lower down in the system on a year by year basis.
Purpose of ANA
Our purpose in conducting and reporting publicly on Annual National Assessments is to continuously measure, at the primary school level, the performance of individual learners and that of classes, schools, districts, provinces and of course, of the country as a whole.
We insist on making ANA results public so that parents, schools and communities can act positively on the information, well aware of areas deserving of attention in the education of their children. The ANA results of 2011 will be our benchmark.
We will analyse and use these results to identify areas of weakness that call for improvement with regard to what learners can do and what they cannot.
For example, where assessments indicate that learners battle with fractions, we must empower our teachers to teach fractions. When our assessments show that children do not read at the level they ought to do, then we need to revisit our reading strategies.
While the ANA results inform us about individual learner performance, they also inform us about how the sector as a whole is functioning.
Going forward, ANA results will enable us to measure the impact of specific programmes and interventions to improve literacy and numeracy.
Administration of ANA
The administration of the ANA was a massive intervention. We can appreciate the scale of it when we compare the matric process involving approximately 600 000 learners with that of the ANA, which has involved nearly 6 million.
There were administrative hiccups but we will correct the stumbling blocks and continue to improve its administration.
The administration of the ANA uncovered problems within specific districts not only in terms of gaps in human and material resources, but also in terms of the support offered to schools by district officials.
ANA results for 2011
Before conducting the ANA, we said we needed to have a clear picture of the health of our public education system – positive or negative – so that we can address the weaknesses that they uncover. This we can now provide.
The results for 2011 are as follows:
In Grade 3, the national average performance in Literacy, stands at 35%. In Numeracy our learners are performing at an average of 28%. Provincial performance in these two areas is between 19% and 43%, the highest being the Western Cape, and the lowest being Mpumalanga.
In Grade 6, the national average performance in Languages is 28%. For Mathematics, the average performance is 30%. Provincial performance in these two areas ranges between 20% and 41%, the highest being the Western Cape, and the lowest being Mpumalanga.
In terms of the different levels of performance, in Grade 3, 47% of learners achieved above 35% in Literacy, and 34% of learners achieved above 35% in numeracy.
In the case of Grade 6, 30% of learners achieved above 35% in Languages, and 31% of learners achieved above 35% in Mathematics.
This performance is something that we expected given the poor performance of South African learners in recent international and local assessments. But now we have our own benchmarks against which we can set targets and move forward.

Conclusion
Together we must ensure that schools work and that quality teaching and learning takes place.
We must ensure that our children attend school every day, learn how to read and write, count and calculate, reason and debate.
Working together we can do more to create a delivery-driven quality basic education system. Only this way can we bring within reach the overarching goal of an improved quality of basic education.
Improving the quality of basic education, broadening access, achieving equity in the best interest of all children are preconditions for realising South Africa’s human resources development goals and a better life for all.
I thank you.

Read the full Statement and some reactions to this statement:

Statement by the Western Cape Education Department
News report by the Mail and Guardian Online 
Statement by the largest teacher union SADTU
Statement by the official opposition

Launch: June 2011 Report on the Progress In Implementing The APRM In South Africa

Progress in implementing the APRM in South Africa Details:
Where: Pan African Parliament – Midrand
Date: Tuesday 28 Jun 2011 -Tuesday 28 Jun 2011
Time: 10:00 -13:00
Event description:
The South African Institute of International Affairs (SAIIA), the Centre for Policy Studies (CPS) and the African Governance Monitoring and Advocacy Project (AfriMAP) will launch the South African APRM Monitoring Project (AMP) Report on Tuesday 28 June 2011 at the Pan African Parliament, 19 Richards Drive, Gallagher Estate, Midrand, commencing at 10:00am.

The report, entitled Progress in implementing the APRM in South Africa, is the first attempt to gauge the views and opinions of civil society about the APRM and its progress in this country, while measuring the commitment levels of the government of South Africa in implementing its National Programme of Action in critical areas such as justice sector reforms; crime; corruption; political participation; public service delivery; press freedom; managing diversity; deepening democracy and overall governance, amongst other issues.
The report is a culmination of a year-long collective effort among CSOs to jointly assess and analyse governance in South Africa. It finds that progress has been admirable in a few areas, but slow in several others.

Details about the event here

ICT in Education: The Threat of Implementation Failure

I am evaluating a few projects looking at the application of ICTs in Education. 

Although my job is to measure the learning outcomes of the projects, it seems that implementation failure is a very real risk. Projects break down even before they can be logically expected to make a difference in learning outcomes. Infrastructure problems and limited skills are some of the big threats. It seems that my projects aren’t the only ones dealing with these kind of implementation challenges.

Greta Björk Gudmundsdottir wrote an interesting article in the open access journal: Internationl Journal of Education And Development: Using Information and Communication Technology. The article is titled:From digital divide to digital equity: Learners’ ICT competence in four primary schools in Cape Town, South Africa. It speaks to specifically computer skills which would be necessary for ICT solutions. She says:

The potential of Information Communication Technologies (ICT) to enhance curriculum delivery can only be realised when the technologies have been well-appropriated in the school. This belief has led to an increase in government- or donor-funded projects aimed at providing ICTs to schools in disadvantaged communities. Previous research shows that even in cases where the technology is provided, educators are not effectively integrating such technologies in their pedagogical practices. This study aims at investigating the factors that affect the integration of ICTs in teaching and learning. The focus of this paper is on the domestication of ICTs in schools serving the disadvantaged communities in a developing country context. We employed a qualitative research approach to investigate domestication of ICT in the schools. Data for the study was gathered using in-depth interviews. Participants were drawn from randomly sampled schools in disadvantaged communities in the Western Cape. Results show that even though schools and educators appreciate the benefits of ICTs in their teaching and even though they are willing to adopt the technology, there are a number of factors that impede the integration of ICTs in teaching and learning.

It would make sense to build teachers’ and learners’ skills to work with ICT while they are required to use ICT for learning, but this may require that the projects deliberately look at ICT skills building as part of delivering the learning solutions.

How Many Days Does it Take for Respondents to Respond to Your Survey?

At my consultancy we use SurveyMonkey for all our online survey needs. It is simple to use, reliable, and they are very responsive.

Their research and found that

The majority of responses to surveys using an email collector were gathered in the first few days after email invitations were sent, and
•41% of responses were collected within 1 day
•66% of responses were collected within 3 days
•80% of responses were collected within 7 days

 The graph below maps the response rate against time.

The findings suggest that, under most circumstances, it would be best to wait at least seven days before starting to analyze survey responses. Sending out a reminder email after a week would probably boost the response rate somewhat.
SurveyMonkey also did some interesting analysis to answer questions like:

How Much Time are Respondents Willing to Spend on Your Survey?

Does Adding One More Question Impact Survey Completion Rate?

Go check it out!

Weekly Funny and Free Resources

Today is Wednesday, but it is the end of my work week, hence the “funny” posted today. Tomorrow, 16 June, is youth day and since I am classified as youth (i.e. under 35 years of age) by the SA government, I am taking my youthful self to a destination slightly South and West of Pretoria for a couple of days. I will celebrate my freedom and remember those who sacrificed much. I will also watch the sun set over the sea, and eat lobster… and fish, and prawns…

Below is an illustration of  how many “black box evaluations” are developed.It comes from a website dedicated to theory of change tools. Check it out!

The DBE’s Annual National Assessments

The Department of Basic Education has started the implementation of the Annual National Assessments.


The biggest advantage of implementing the ANA, is that it supplements the information about education outcomes and quality currently in place in the Education SystemIn the DBE notice to all parents, the purpose of the ANA was explained as follow:

1) Teachers will use the individual results to inform their lessons plans and to give them a clear picture of where each individual child needs more attention, helping to build a more solid foundation for future learning. 2) The ANA will assist the Department to identify where the short comings are and intervene if a particular class or school does not perform to the national levels

It is unlikely that a single short test, administered at the beginning of each school year, will be more effective at providing feedback to teachers about the individual needs of learners, than the current assessments mandated by the DBE’s assessment policies. Continuous assessment policies already require teachers to test learners for this purpose, and if this information has not been used up and ‘til now, it is unlikely that instituting another assessment will make an impact in the school system. Rapid assessments have been shown[1] to be a very cost effective strategy for learner performance, but this requires frequent assessments and teachers with the capacity to analyse and use the results.

Assessments like these have been shown to be a useful accountability tool, depending on how the results are used[2] . It is unclear at this stage how exactly schools and teachers will be held accountable. The results will be shared with parents – which may or may not start a process where parents become more informed and involved in school quality issues. But, these results will have to be interpreted very carefully. A great teacher might produce poor literacy results because the learners in the school only started speaking the language of learning and teaching a year before. This is not a fault of the teacher… yet it might be very tempting to use it as a tool for blame. On the other hand, if the learner results show that there is a problem with a specific teacher or a specific school – How exactly will the DBE intervene? Will they have the support and the necessary information to intervene positively? Is it fair to only target maths and language teachers for “intervention” if poor numeracy and literacy results are found? Certainly, it will not benefit the Education system if the ANAs serve to antagonise the educators.


[1] Yeh, S.S. (2011). The Cost-Effectiveness of 22 Approaches for Raising Student Achievement. Information Age Publishing.
[2] Bruns, B.; Filmer D. and Patrinos, H.A. (2011). Making Schools Work. New Evidence on Accountability Reforms. Washington D.C, World Bank. Accessed online on 13 June 2011 at http://siteresources.worldbank.org/EDUCATION/Resources/278200-1298568319076/makingschoolswork.pdf

The theory behind Sensemaker


Yesterday I posted about Sensemaker. A discussion on the SAMEA listserve ensued. Kevin Kelly  posted this:
 The software (sense maker) is founded on a conceptual framework grounded in the work of Cognitive Edge (David Snowden). The software is very innovative, but not something that one can simply upload and start using. One really needs to grasp the conceptual background first. It should also be noted that the undergirding conceptual framework  (Cynefin) is not specifically oriented to evaluation practice, and is developed more as a set of organisational and information management  practices. I am hoping to run a one-day workshop at the SAMEA conference which looks at the use of complexity and systems concepts, and which will outline the Cynefin framework and explore its relevance and value for M&E.

I think I’ll sign up for Kevin’s course. I have been reading a little bit about Complexity and evaultion lately.

In case someone else is interested in reading up about specifically cynefin and more general complexity concepts I share some resource (with descriptions from publisher’s websites)
  1. Bob Williams and Hummelbrunner (Authors of the book Systems Concepts in Action: A practitioner’s Toolkit ) presented a work session at the November 2010 AEA conference where he introduced some systems tools as it relates to the evaluator’s practice
Systems Concepts in Action: A Practitioner’s Toolkit explores the application of systems ideas to investigate, evaluate, and intervene in complex and messy situations. The text serves as a field guide, with each chapter representing a method for describing and analyzing; learning about; or changing and managing a challenge or set of problems. The book is the first to cover in detail such a wide range of methods from so many different parts of the systems field. The book’s Introduction gives an overview of systems thinking, its origins, and its major subfields. In addition, the introductory text to each of the book’s three parts provides background information on the selected methods. Systems Concepts in Action may serve as a workbook, offering a selection of tools that readers can use immediately. The approaches presented can also be investigated more profoundly, using the recommended readings provided. While these methods are not intended to serve as “recipes,” they do serve as a menu of options from which to choose. Readers are invited to combine these instruments in a creative manner in order to assemble a mix that is appropriate for their own strategic needs.

  1. Another good reference about Systems concepts I found was Johnny Morrell’s  Book – Evaluation in the Face of Uncertainty. 

Unexpected events during an evaluation all too often send evaluators into crisis mode. This insightful book provides a systematic framework for diagnosing, anticipating, accommodating, and reining in costs of evaluation surprises. The result is evaluation that is better from a methodological point of view, and more responsive to stakeholders. Jonathan A. Morell identifies the types of surprises that arise at different stages of a program’s life cycle and that may affect different aspects of the evaluation, from stakeholder relationships to data quality, methodology, funding, deadlines, information use, and program outcomes. His analysis draws on 18 concise cases from well-known researchers in a variety of evaluation settings. Morell offers guidelines for responding effectively to surprises and for determining the risks and benefits of potential solutions.

His description about the book is here 

 
  1. And then Patton’s latest text (Developmental Evaluation – Applying Complexity Concepts to Enhance Innovation)  also touches on complexity issues and Cynefin  .
Developmental evaluation (DE) offers a powerful approach to monitoring and supporting social innovations by working in partnership with program decision makers. In this book, eminent authority Michael Quinn Patton shows how to conduct evaluations within a DE framework. Patton draws on insights about complex dynamic systems, uncertainty, nonlinearity, and emergence. He illustrates how DE can be used for a range of purposes: ongoing program development, adapting effective principles of practice to local contexts, generating innovations and taking them to scale, and facilitating rapid response in crisis situations. Students and practicing evaluators will appreciate the book’s extensive case examples and stories, cartoons, clear writing style, “closer look” sidebars, and summary tables. Provided is essential guidance for making evaluations useful, practical, and credible in support of social change.
  1. Rogers also published a nice article in 2008 in the Journal Evaluation about this 
 This article proposes ways to use programme theory for evaluating aspects of programmes that are complicated or complex. It argues that there are useful distinctions to be drawn between aspects that are complicated and those that are complex, and provides examples of programme theory evaluations that have usefully represented and address both of these. While complexity has been defined in varied ways in previous discussions of evaluation theory and practice, this article draws on Glouberman and Zimmerman’s conceptualization of the differences between what is complicated (multiple components) and what is complex (emergent). Complicated programme theory may be used to represent interventions with multiple components, multiple agencies, multiple simultaneous causal strands and/or multiple alternative causal strands. Complex programme theory may be used to represent recursive causality (with reinforcing loops), disproportionate relationships (where at critical levels, a small change can make a big difference — a `tipping point’) and emergent outcomes. 
For more resources, try AEA 365

Sense Maker

In a previous post, I ventured that we should start questioning the archaic. Our methods and our ways of communicating results haven’t changed much over the past 10 years or so, despite new technologies and preferences.

I have posted a number of examples of interesting data visualizations, but the clip below introduces a new way of collecting information, with the help of a product called Sensemaker

Here Irene Guijt talks about Sensemaker in the context of Evaluation.

Here is an article in the Stanford Social Innovation Review about a real life application done by Global Giving.

Data Visualization: Museum of Me

Presentation of information is important to anyone that wants to make an impact with what they say. Intel dreamed up another interesting way of presenting different kinds of information.

If you have a facebook profile (and you don’t mind intel punting their product a bit), why not take a walk in your own museum of you? The “Museum of Me” compiles all your Facebook information and creates a three-minute long expose about you. It could be scary… In the same way as listening to your own recorded voice could be scary. Gizmodo says that this is a reminder why you should’nt be using facebook!

Survey answers when you ask people to state the obvious

You run a survey and you ask two questions which should have fairly straightforward answers: 
Question 1: Are you Male / Female?
Question 2: What Colour is this?

The following comic from doghouse diaries, and the results of an actual colour survey at xkcd tells you a little about the validity of surveys…

The write-up about the “male / female” categories and the controls they tried to implement for color blindness at the xkcd blog is also something worth reading.

Evaluation Tasks

I found this graphical representation of Evaluation Tasks from Better Evaluation very useful for thinking about the evaluation process.

(Click on the pic for a larger version).

In my experience the “synthesize findings across evaluations”-bit gets neglected. In my work as an evaluator contracted to many corporate donors, I am usually required to submit an evaluation report for use by the client. I often have to sign a confidentiality agreement that prohibits me from doing any formal synthesis and sharing, even if I am doing similar work for different clients. Informally, I do share from my experience, but the communication is based on my anecdotal retellings of evidence that has been integrated in a very patchy manner.I try to push and prod clients into talking to each other about common issues, but this rarely results in a formal synthesis.
  
It is not always feasible for the clients who commission evaluations to do this kind of synthesis. Their in-house evaluation capacity rarely includes the meta-analysis skill, and even if they contract a consultant to conduct a meta-analysis based on a variety of their own evaluations, there are some problems: Aggregating findings from a range of evaluations that do not pay attention to the possibility that a meta-analysis will be done somewhere in the future, requires a bit of a “fruit-salad approach” where apples and oranges, and even some peas and radishes, are thrown together. Another obvious problem is that donors who do not care to share the good, bad and ugly of their programs with the entire world, would be hesitant to make their evaluations available for a meta-analysis conducted by another donor. 
Perhaps we require a “harmonization” effort among the corporate donors working in the same area?

Dunning-Kruger Effect and Evaluation

Justin Kruger and David Dunning published a paper in the Journal of Personality and Social Psychology (1999, Vol 77, No.6, 1121 -1134) and the term “Dunning Kruger effect” was coined.  This is the abstract:

People tend to hold overly favorable views of their abilities in many social and intellectual domains. The authors suggest that this overestimation occurs, in part, because people who are unskilled in these domains suffer a dual burden: Not only do these people reach erroneous conclusions and make unfortunate choices, but their incompetence robs them of the metacognitive ability to realize it. Across 4 studies, the authors found that participants scoring in the bottom quartile on tests of humor, grammar, and logic grossly overestimated their test performance and ability. Although their test scores put them in the 12th percentile, they estimated themselves to be in the 62nd. Several analyses linked this miscalibration to deficits in metacognitive skill, or the capacity to distinguish accuracy from error. Paradoxically, improving the skills of participants, and thus increasing their metacognitive competence, helped them recognize the limitations of their abilities.

Errol Morris described how the following sad story about a guy called McArthur Wheeler, inspired Dunning’s scientific inquiry:

Wheeler had walked into two Pittsburgh banks and attempted to rob them in broad daylight.  What made the case peculiar is that he made no visible attempt at disguise.  The surveillance tapes were key to his arrest.  There he is with a gun, standing in front of a teller demanding money.  Yet, when arrested, Wheeler was completely disbelieving.  “But I wore the juice,” he said.  Apparently, he was under the deeply misguided impression that rubbing one’s face with lemon juice rendered it invisible to video cameras. If Wheeler was too stupid to be a bank robber, perhaps he was also too stupid to know that he was too stupid to be a bank robber — that is, his stupidity protected him from an awareness of his own stupidity.

What does this have to do with evaluators? All I suggest is that you should think a little about the Dunning-Kruger effect next time you ask people to rate their own competence level in a survey. You would not want to design such a survey without knowing that it is not a very smart thing to do, right?

Alternatively you might want to read an earlier post I did about it here.

Data Quality – An Evaluator’s Job?

Recently, P.Allison Minugh posted this question on the AEA group on LinkedIn:

I find there isn’t much interest in data management, so I am curious: How important is data management to your evaluation studies, and why or why not? 

My Response was: 

In South Africa, the issue of data management has been consistently handled under what we call “data quality” or “information quality” specialization fields. It has become increasingly more visible at our evaluation conferences, and we are starting to develop a framework for the training and certification of information quality professionals.

Recently there was a Data Quality Conference in Pretoria, and my impression was that Data Management seems to be an IT function in the USA (with a push towards standards like ISO 8000). Here, In South Africa, it is often part of the M&E officer’s job. It really is a grassroots concern – How to capture clinical data from paper records, how to make data available across clinics, how to reduce double counting, how to ensure that data collection tools are designed to enhance VRIPT (Validity, Reliability, Integrity, Precision and Timeliness), how to set up your Data Management System (Collection, Collation and Capturing, Reporting and Use) to ensure optimal quality and use.

Data Quality Assessments and Audits have become increasingly more pervasive – in especially the Health Sector (where District Health Information Systems need to produce all kinds of data for reporting on development initiatives, also to major donors like USAID) and the Education Sector (where the Educational Management Information System is used).

Some of my colleagues at FeedbackRA have recently done the “Information Quality Certified Professional” course. More info on this at: http://www.feedbackra.co.za/data-quality-qualifications/

A good book on the topic is titled “Data Quality Assessment” by Arkady Maydanchik


Values and Evaluation

The AEA’s Annual Conference (Wednesday, November 2, through Saturday, November 5, 2011 in Anaheim, California) will focus on Values. eVALUation was also the topic of the last SAMEA conference in 2009.
Jennifer Greene says about this theme:
Like culture, evaluation is inherently imbued with values. Our work as evaluators intrinsically involves the process of valuing, as our charge is to make judgments about the “goodness” or the quality, merit or worth of a program. Judgments rest on criteria, which in turn reflect priorities and beliefs about what is most important. At Evaluation 2011, I would like us to take up the challenges of values and valuing in evaluation, particularly the plurality of values represented by different evaluation purposes and audiences, key evaluation questions, and quality criteria. I anticipate that greater attention to and openness in the value dimensions of our work can improve our practice, offer voice to diverse stakeholder interests, and enhance our capacity to make a difference in society.
Last week, as we celebrated Africa Day, I thought a little about what it means to be an African. This was my FB status update for the day:
I dream in a language that grew up on the African continent, my forebears shed blood, sweat and tears to help tame the land that is my home, and the spirit of Ubuntu directs my choices. In the words of Mbeki: “I am an African”.
This made me think about the philosophy of Ubuntu and how it translates into values which affect my dealings as an evaluator. Ubuntu means “I am what I am because of who we all are”
The Arch, Desmond Tutu, explained it so:
A person with Ubuntu is open and available to others, affirming of others, does not feel threatened that others are able and good, for he or she has a proper self-assurance that comes from knowing that he or she belongs in a greater whole and is diminished when others are humiliated or diminished, when others are tortured or oppressed.Ubuntu speaks particularly about the fact that you can’t exist as a human being in isolation. It speaks about our interconnectedness. You can’t be human all by yourself, and when you have this quality – Ubuntu – you are known for your generosity. 
There is a Zulu saying: “umuntu ngumuntu ngabantu” which means:  a person is a person through (other) persons” which is very different from “Cogito ergu sum” or “I think, therefore I am”.  
I could immediately think of five implications that Ubuntu has for evaluators:
  • You need to be very aware of your role and the role of others as representatives of a bigger collective. Mutual respect is of the utmost importance. This “respect” will affect the way in which you ask questions, and you must interpret people’s answers in this context. Do not be surprised if you have to go to great lengths to get people to provide constructive criticism.  
  • When you share evaluation feedback, affirmation is very important. When you share negative findings, it must never be humiliating for an individual or a group of people.
  • As an evaluator, you are part of the bigger picture. You have an important role to play in a system of interconnected people, organizations and stories. If you try to be the “know-it-all external evaluation specialist” you will hit a wall. Listening and conversing, allowing people to participate in the meaning creation process, is essential.
  • There are many opportunities for “being generous”: If you evaluate a community based organization that takes time to answer your questions and provide you with some of their truly South-African hospitality, you might as well provide something in return. Writing up the evaluation findings in a form that they (not only the donor) can understand and use is one way. Sharing some of your technical knowledge (e.g. how to organize data, where to find a budget template, contact details of other people who work in the same field and could assist) is another way. Sometimes you might even share your evaluation tools and templates with people who did not pay for this “intellectual property”.
  • You have a responsibility to give back. Taking an inexperienced evaluator under your wing or volunteering your time for a good cause shows that you recognize you are where you are because others were willing to share with you. It is not uncommon for people who stay in abject poverty to share the little that they have with each other. Those who have more, probably have a responsibility to share more.

Lessons for Evaluators

This week, a vicious rumour circulated that the speech below was delivered by a mayor of a large South African city. 

Barrie Bramley, writes that it is, however, an unedited clip recorded by an actor for a milk advertisement.

Both the vicous rumour, and the contents of the clips have some lessons for evaluators:

1. Using big words in your reports and presentations will not hide an incoherent argument
2. Being long-winded bores your audience and delays tea
3. Sources should be double checked ALWAYS!
4. Comments made should be based on checked facts.

Have a lovely week!

22 Seems to be the Magic Number in Solving Education problems!

In a previous post, I introduced the book by Stuart S. Yeh Entitled “The Cost-Effectiveness of 22 Approaches for Raising Student Achievement”.
Now the World Bank released a report entitled “Making Schools Work – New Evidence on Accountability Reforms” which is based on 22 recent impact evaluations of accountability-focused reforms in 11 developing countries. I wonder why this fascination with the number 22?

In the book (written by Barbara Burns, Deon Filmer and Harry Anthony Patrinos) they investigate strategies to address “service delivery failures” where increased spending does not lead to a concomitant change in education output (completion) or outcomes (learning). The idea is that if people in the schooling system are held accountable, things will improve.

This book focuses specifically on

three key strategies to strengthen accountability relationships in school systems—information for accountability, school-based management, and teacher incentives

 and looks into how these can affect school enrolment, completion, and student learning.

Main findings about the three strategies include:


Information for accountability (for example – providing “school report cards”) seems to work, but it isn’t a solution to all the problems. Which information is shared, who it is shared with and how it is shared are important considerations which could help parents, communities and other role players identify where the weaknesses in the system is.


School based management reforms (e.g. implementing effective school governance, and school based management) are effective, but these “reforms need at least five years to bring about fundamental changes at the school level and about eight years to yield significant changes in test scores”


Teacher incentives of two kinds have been investigated: Contract teachers (where teachers are contracted on condition that they deliver certain results), and pay for performance reforms (bonuses from meeting targets) seem to be successful too, but perverse behaviours (Such as gaming, cheating or teaching to the test) are likely to abound and eventually negate the overall success of this strategy.

We’ve seen some progress in this regard in the South African schooling system: School Management and Governance training remains an important component of “whole school” development, and the implementation of the Annual National Assessments (ANA) is likely to evolve into an “information for accountability” initiative. (Also see this article about the ANA’s in the local press). Perhaps its time to take the hand of the labour unions and see how incentivising teachers can be implemented?

Cohen’s d and Effect Size

In my previous posting I explained the idea of significance testing. A statistically significant result does not necessarily mean that the result is practically significant. The “effect size” usually gives an indication of whether something is practically significant.

There are a couple of different ways of calculating an effect size.

r which is the correlation coefficient or R² which is the coefficient of determination
Eta squared ή²

Cohen’s d

This time, I will focus on Cohen’s d.

If you did a t-test, it’s usually a good idea to calculate cohen’s d.

Cohen’s d is an appropriate effect size for the comparison between two means. It indicates the standardized difference between two means, and expresses this difference in standard deviation units. The formula for calculating d when you did a paired sample t test is:

Cohen’s d = Mean difference

                 Standard deviation

If you have two separate groups (in other words you conducted an independent sample t test), you use the pooled standard deviation  instead of the standard deviation.

If Cohen’s d is bigger than 1, the difference between the two means is larger than one standard deviation, anything larger than 2 means that the difference is larger than two standard deviations. It is seldom that we get such big effect sizes with the kinds of programmes that I evaluate, so the following rule of thumb applies:

A d value between 0 to 0.3 is a small effect size, if it is between 0.3 and 0.6 it is a moderate effect size, and an effect size bigger than 0.6 is a large effect size.

Here is an example:

Kids wrote a grade 12 exam, then completed a programme that provides additional compensatory education, and then they rewrite the grade 12 exam. Below is a table that compares the Maths mark prior to the programme, to the Maths mark after the programme.

The result is statistically significant (see the last column, p < .000). The learners’ results, on average, improved with about 9.9% (Mean difference is indicated in the “mean” column. Usually such a result is indicated as follow:

t (54) = 6.852; p <  .000

To calculate Cohen’s d, we divide the mean difference by the standard deviation

d = mean difference/ standard deviation = 9.98148 / 10.70442 = 0.932

0.932 is larger than 0.6 so this can be classified as a large difference. In fact it is close to 1, which means that this programme probably helped the learners, on average, to improve their marks with about 1 standard deviation. That is amazing!

Means and p values.

On comparing two groups’ means (or averages), it’s not sufficient to only compare the means –Because an average is just one statistic that summarises a whole distribution of scores.


In the picture below, the mean age at which these kids first drank alcohol, was around age 14. But there are kids who started earlier, and some who started later.


When comparing two means, it is important to determine whether the two distributions differ so much, that it is unlikely that they are both from the same bigger population.


If they differ, the null hypothesis is rejected. If they don’t differ, the alternative hypothesis is rejected.


Notice: although the means differ in B, the overlap in distributions is quite large.


Depending on the scale of the data (nominal, ordinal, interval or ratio) the properties of the distributions (normally distributed or not) and the kind of comparison that’s required (i.e. two independent groups e.g. boys and girls; or two measures for the same group e.g. average for boys before the programme, and after the programme) different statistics may be used.

Usually, we do a t test which yields a t statistic or an ANOVA which yields an F statistic, or their non-paramatric equivalents – the Mann Whitney or Kruskall Wallis test. Because it isn’t very easy to off- hand know if a t of 112 is good or bad, these statistics are converted to a p value (probability value) which indicates how probable it is that the null hypothesis is true.


If the p value is smaller than <0.05, the null hypothesis is rejected – there is only a 5% chance that the two distributions are the same.

Just look carefully at that criterion: p values of 0.5 (50%) and 0.06 (6%) are bigger than 0.05, the null hypothesis will be accepted. A p value 0.045 (4.5%), or any value such as p < 0.000, is smaller than 0.05 and would therefore mean the null hypothesis should be rejected – in other words, the two means differ statistically significantly.

A cut off of p = 0.05 is conventional, but a p of 0.1 (10%) or 0.001 (1%) is sometimes used as a cut-off criterion (depending on the likelihood of Type I and Type II errors)

A result like the one below means:
t (163) = -2.68, p < .05
The t statistic for the means calculated from two groups with 163 cases is -2.68, and is statistically significant at the 5% level.


F (2, 1015) = 111.286, < .001
The F statistic, for a sample of 1015 cases with 2 degrees of freedom (i.e. three groups) is 111.286 and is statistically significant at the 1% level.


The smaller the p value is, the happier you should be – because it means that you will have something interesting to report on!

The Evaluator and Statistics

I had to calculate Cohen’s d, Eta Squared and r today, but thought that would be too dreary a topic for a Friday blog post.

Instead, I found some statistics quotes here

Some of my favourites:
Torture numbers, and they’ll confess to anything. ~Gregg Easterbrook

He uses statistics as a drunken man uses lampposts – for support rather than for illumination. ~Andrew Lang

Statistics can be made to prove anything – even the truth. ~Author Unknown

Evaluation of iPad for Education

Reed College, in Portland Oregon, reports on their evaluation of the use of the iPad in class here. Reports on the use by students and faculty are available.

Whereas a previous evaluation was very critical of the usefulness of the Kindle DX in the class context, this report seems to support the adoption of tablets in the classroom.

The report particularly commented positively on the legibility of material on the iPad, the usability of the touch screen and the size and weight of the tablet. It was also found to be particularly useful if students wanted to switch between texts in class, and the search ability and navigation within texts was also positively evaluated.

They commented that PDF transferability was somewhat difficult, the filing system was not optimally user friendly and that the on-screen keyboard of the iPad did not efficiently support more than short comment typing. Some other concerns related to cost factors and accessibility

Better Evaluation Virtual Writeshop

Irene Guijt posted this on the Pelican List serv today

Perhaps you have undertaken an evaluation on a program to mitigate climate change effects on rural people living in poverty, or one on capacity development in value chains. Or worked on participatory ways to make sense of evaluation data, or developed simple ways to integrate numbers and stories. We’d like to bring unknown experiences to the global stage for wider use.

Do you have an experience that covers many different aspects of evaluation – design, collection, sensemaking, and reporting? Did you look at different options to develop a context-sensitive approach? And has your evaluation process not yet been shared widely? If your answer is yes to these questions, then our virtual writeshop on evaluation may be of interest.

We will facilitate a virtual writeshop between May and September 2011 that will lead to around 10 focused documents to be shared globally. Participating in the writeshop will give you structured editorial support and peer review to develop a publication for the BetterEvaluation site.

For more information, including how to submit a proposal, go here.

22 Approaches for Raising Student Achievement

I’m working my way through a book by Stuart S. Yeh Entitled “The Cost-Effectiveness of 22 Approaches for Raising Student Achievement” (Also available as an ebook http://ow.ly/4R62s or on paper from www.loot.co.za see: http://ow.ly/4RRll)


The book (based on Studies in the States) concludes that:

The review of cost-effectiveness studies suggests that rapid assessment is more cost effective with regard to student achievement than comprehensive school reform (CSR), cross-age tutoring, computer-assisted instruction, a longer school day, increases in teacher education, teacher experience or teacher salaries, summer school, more rigorous math classes, value-added teacher assessment, class size reduction, a 10% increase in per pupil expenditure, full-day kindergarten, Head Start (preschool), high-standards exit exams, National Board for Professional Teaching Standards (NBPTS) certification, higher teacher licensure test scores, high-quality preschool, an additional school year, voucher programs, or charter schools

.

I find this interesting, because this makes a very compelling argument for using computer based learning in schools. The first chapter of the book presents a nice theoretical overview that indicates how kids become disheartened if they don’t consistently have mastery experiences. If assessment and teaching can be individualized so that each learner progressively improves compared to their previous performance (rather than a comparison with peers) they are likely to feel that they are in control of their learning, and they would be more likely to stay engaged in the learning process. The chapter states:

A theory of learning may be deduced: Individualization of assessment, task difficulty and performance expectations for each student on a daily basis, in combination with performance feedback, autonomy in task execution and an accelerating standard of performance, ensures that students achieve success and feel successful on a daily basis, fostering student engagement, increased effort, and further improvements in achievement in a virtuous cycle.

Software can automate the provision of corrective feedback, and assigning of content (on a daily basis) and this has been shown to have powerful effects on learning and achievement. Yeh reports that in a study of Math Assessment, (involving 1,880 students in grades 2 through 8, 80 classrooms and seven states) they found an effect size of 0.324 Standard deviations over a 7 month period. This is a huge increase in learner performance.

Of course we need to remember that this is based on the American school system that is very different from ours. And note the study is about “Cost Effectiveness”. It is not saying that the other strategies are not effective – In their context the other strategies were effective but at a higher cost than Rapid Assessment

Of course there are a few other assumptions that will have to be checked if a similar intervention is implemented in South Africa:
1) Computer infrastructure, technical support, and teacher’s abilities must be supportive of successful implementation. It is a lot harder to implement an ICT based project than one might imagine at the outset.
2) Rapid assessment cannot replace the role of the teacher – It can help learners improve, but they still have to get quality tuition from a qualified teacher.
3) Learners’ ability to interact with the software must not be blocked by poor reading / language capabilities.

GIS Data and Maps to Find South African Health Facilities

Here is a neat resource I came across at the ESI Data Quality Conference held in March.

It contains some basic data and various layers of health facility data in South Africa, and allows easy map sharing. Check it out at:

http://www.mapsharing.org.za:8008/mapguide/fusion/templates/mapguide/slate/

Some Educational ICT solutions I’ve come across

VITALmaths which is a collection of video clips that’s accessible from cellphone. They demonstrate basic maths concepts.

LearnThings which provides online learning resources for Maths and Science teaching.

Crocodile Clips a variety of maths games.

Connexions a repository of online teaching and learning resources.

Master Maths M2 Computer Based Training proprietary software for self paced Maths Learning

NovaNet and Success Maker proprietary software from the USA for self paced learning available through a South African distributor

Tools to create infographics.

This post from Fast company provides an overview of some tools for creating info graphics.

They discuss:
Many Eyes
Which allows you to visually represent some data sets that they have available, or allows you to upload your own to play with.

Google Public Data Explorer
Which is a public version of one of Google’s research tools.

Hohli
Which helps you to create and customzie Venn Diagrams. Hohli also allows you to create other charts, including scatter plots and other line charts.

Wordle
Although this tool describes itself as a “toy” for generating word clouds, it can be an effective service to spruce up your work.

Visual.ly
Is a new tool (still being tested), that will allow you to create and share infographics. From a first look on YouTube, this new service will be a great resource to create a compelling storytelling visualization. A youtube clip explains it all

Groups of Teachers building their own capacity?

A client requires an evaluation of a teacher development initiative. This initiative aims to establish a teacher network which brings teachers from different schools together. It is hoped that the teachers will develop their own capacity with the help of a facilitator that has some content to share.

Rogers & Funnell (2010 – Purposeful Programme Theory, Jossey Bass) introduced me to some network theory, and they also provide a representation of a community capacity building programme “archetype”. This archetype sets out the steps which must occur for this kind of programme to work. The steps are: (Not necessarily in a linear order).

1. Community develops a better understanding of issues,
opportunities, and challenges that it can address and potential
projects, activities, or processes through which to address them.

They then mobilise their human capital, social capital, institutional capital, economic capital and natural capital, which may result in:

2. Community developing an awareness and understanding of one or
more elements of its existing capacity.

3. Community develops a better understanding of the relevance of
its existing capacity to take up opportunities, projects, and
challenges, what further capacity is required, and who requires it.
write-up of Network Theory that I found particularly useful

4. Community identifies and undertakes activities, processes, and
projects that successfully develop required capacity

5. Community taps into and applies existing and/or newly
developed capacity to address challenges and seize opportunities

6. Community identifies how it can sustain and enhance its
capacity and looks for new opportunities to apply capacity

7. Stronger Communities:
Enhanced and maintained well-being of communities

The evaluation sets out to look for proof that the teacher development worked: by checking if the teachers’ practices have changed, and looking for evidence that the learners have benefited. I’m making the argument that the result of establishing a sustainable network should also be looked at separately – as a different category of results.

To evaluate the network, we’ll have to use social network analysis methods. An AEA LinkedIn discussion alerted me to a programme called NODEXL (A free plug-in for Excel)
which I intend to try out.

This tutorial from the “Findings group” explains some basic concepts in social network analysis.

All that’s left to do, is to apply these new things and to explain to colleagues that Social Network Analysis has nothing to do with Facebook or Twitter!

Using Dashboards to communicate findings

Shaku Atre says:
“The fundamental premise of business intelligence has traditionally been “to provide the right information to the right people at the right time and at the right cost.” While this statement is irrefutable, it would be more accurate if we changed the word “information” to “actionable information.”

This sounds quite similar to the UFE focus of ensuring that evaluation findings are available to the intended users for the intended use!

In communicating results in a useful manner, this resource http://ow.ly/4xlQn from Information Management shares some interesting ideas about Dashboards.

Hypothetical Crucial Confrontations

Every Utilization Focused Evaluator knows: If an evaluation deliverable is submitted late, it can potentially totally negate the reason for doing the evaluation in the first place. If the intended user does not have the information at his/her disposal when the time for the intended use comes, you have a disaster.

Late delivery and a whole range of unpleasant consequences can be prevented, if you have the skill of holding people accountable for broken promises along the way. I find holding my team accountable is relatively easy, but holding a client accountable for broken commitments, is quite a different ballgame- A very unpleasant and daunting one!

Imagine the following totally hypothetical* example: You are working with a client who commits to giving feedback on deliverables by a certain date, and by the time you get to that date, there is no feedback. Or no consequential feedback. Then you try to get sign-off on deliverables, but a second and third round of comments follow, and it takes forever to move along. Hypothetically speaking, it could take you 8 months to get sign off on one deliverable!

It could be really difficult to work effectively with such a (hypotehtical) client, and you may start to doubt your own ability to execute. I cringe if I look at it from the hypothetical client’s perspective – and I’m not sure what this must look like to a hypothetical innocent bystander.

Evaluation team leaders need to be able to hold their clients accountable for broken commitments, else the team may be heading for a deep and dark place where everyone just ends up hating working together.

I’m reading a book called “Crucial Confrontations” on exactly this topic. It is packed with so many interesting concepts. I can highly recommend it. See: http://ow.ly/4waEW (Also available on Kindle!)

The book has taught me to be a little bit more discerning about the actual problem that needs to be addressed (amongst other things). Who would’ve thought that what seems like a simple (hypothetical) problem can actually be so very complex?

1) If the problem is a single instance of not receiving feedback all you need to do is follow up with the client until he / she has met his / her commitment. Getting the feedback once, means the problem is resolved.

2) If the problem is a pattern of broken commitments, just dogging the client until he/ she provides feedback will probably only resolve the problem until the next round of feedback is due. Perhaps the process of feedback and signoff should be changed, to break this pattern?

3) But the problem may be a relationship problem. If the client is in a difficult position in his / her organization he / she may be unable to act quickly / definitively / at all. No amount of process change will solve this quandary. If a pattern of broken commitments have lead to tensions in the relationship between the client and the evaluator, interacting is likely to become more difficult as time goes by, and more commitments will be broken. The solution that is required, is a fix for the relationship!

The book has so many other good suggestions, which would be very handy in planning interactions with a hypothetical problem client. May you never have the need of applying these skills!

**********************************************************************
*My husband says that when people say “theoretically” they mean “not really”. When I say hypothetically, I mean exactly that!

AEA 365

The American Evaluation Association has this AEA365 service, which is really cool. I love what they have done with it. I only today managed to look at it in detail and its now my new favourite resource to recommend to new evaluators.

See www.eval.org aea365 Tip-a-Day Email Alerts: We’re highlighting hot tips, cool tricks, rad resources, and lessons learned for and from evaluators Evaluation Tip-a-Day Emails

In 2007 I actually wrote a concept note for a service like this when I was at an AfrEA workshop in Niamey, Niger. Subsequently I mentioned it at the SAMEA conference as a potential service and everyboy thought it was a good idea. But I just did not have the resources at my disposal to make it happen. During that time I was invovled in running the operations of SAMEA and later AFREA so all my volunteer time and inspiration was swallowed up there. And although I thought that graduate students might be best placed to start compiling the content, I just never could find someone that would be willing to drive such an idea. So I am soooooooo happy that AEA had the same smart idea and were actually able to pull together the resources to make it a reality.

Categorizing Educational Qualifications

I had to look at a survey for a colleague. She was interested in getting information about the education and qualifications of survey respondents and just put in an open-ended question.

Bad idea! Why? Have you ever tried to afterwards classify people’s qualifications into coding categories? I’m sure it can be done but its much better to give the people your classification categories, and have them select the appropriate options.

Before we get to the classification question, decide whether you only want to know what a person’s highest qualification is, or whether you want to know which combination of qualifications a person holds. Usually we ask for highest only, but this depends on your research interest.

In South Africa we have SAQA (the South African Qualifications Authority) that provides the qualification framework and they are the best people to consult if you want a detailed qualifications framework applicable in South Africa. We seldom want this, because most people don’t know what the difference between and NQF level 3 and 4 qualification is. A cool trick is to see what Stats SA uses. This is from an old General Household Survey questionnaire:

Note to users
This question is applicable to all household members. The enumerators are instructed that it is only those qualifications already obtained which must be entered. That means the current level, whereby a person is still busy with is not applicable. It is very important to complete each record even if the person has not attended school. Moreover the enumerators are instructed that diploma and certificates must be of at least six months duration.

Universe
All members of the household in the selected dwelling.

Final code list
0 = NO SCHOOLING
1 = GRADE R/0
2 = SUB A/GRADE 1
3 = SUB B/GRADE 2
4 = GRADE 3/STANDARD 1
5 = GRADE 4/STANDARD 2
6 = GRADE 5/STANDARD 3
7 = GRADE 6/STANDARD 4
8 = GRADE 7/STANDARD 5
9= GRADE 8/STANDARD 6/FORM 1
10 = GRADE 9/STANDARD 7/FORM 2
11 = GRADE 10/STANDARD 8/FORM 3
12 = GRADE 11/STANDARD 9/FORM 4
13 = GRADE 12/STANDARD 10/FORM 5/MATRIC
14 = NTC l
15 = NTC II
16 = NTC III
17 = DIPLOMA/CERTIFICATE WITH LESS THAN GRADE 12/STD 10
18 = DIPLOMA/CERTIFICATE WITH GRADE 12/STD 10
19 = DEGREE
20 = POSTGRADUATE DEGREE OR DIPLOMA
21 = OTHER (specify in column)
22 = DON’T KNOW
99 =UNSPECIFIED

This would unfortunately not work for my colleague because she is doing a survey with respondents who trained all over the world.

The international Equivalent of the SAQA standards is ISCED – The International Standard Classification of Education. It is an UNESCO standard and the last revision was in 1997.

ISCED provides an integrated and consistent statistical framework for the collection and reporting of internationally comparable education statistics. It contains two components:

a statistical framework for the comprehensive statistical description of national education and learning systems along a set of variables that are of key interest to policy makers in international educational comparisons; and

a methodology that translates national educational programmes into an internationally comparable set of categories for (i) the levels of education; and (ii) the fields of education.

Find ISCED here:
http://www.unesco.org/education/information/nfsunesco/doc/isced_1997.htm

Communicating Data

This week, I sat in a two day information quality conference. One of the key points was that data is not necessarily being used to improve service delivery, because (very simplistically)

* data quality is problematic, and
* we don’t have people who can tell the story of the data so that others can relate to it.

I’ve already decided that my new thing for this year will be to think about communicating data. So Im seraching for good examples of visualization methods.

A friend sent this interesting example along:
http://www.guardian.co.uk/world/interactive/2011/mar/22/middle-east-protest-interactive-timeline

And another friend alerted me to this website:
http://www.informationisbeautiful.net/

“Development “

Aid on the edge posted a little satirical cartoon that made me reflect on the value of “development” as we do it these days.
See: http://aidontheedge.info/2011/03/23/there-you-go/

But that is only one side of the coin:

A friend once told me that he worked in development in Africa, and admitted to forcing a Western idea of education into a local village many years ago. The contemporary wisdom is that one should rather embrace indigenous knowledge systems and community structures. When he went back many years later, he wanted to “repent” of his youthful folly.

When he got there, there wasn’t much left of the village. Sadly climate change has wreaked havoc and the village’s agricultural lifestyle could not longer be sustained. If it wasn’t for the “out of place” education initiative that my friend started many years earlier, there would have been no livelihood for the villagers. At least the kids who got educated, got out. They were now earning a living in another way, sending back some money.

I’m not suggesting that forcing education was the right thing to do, but we can also not blame the education and local development for climate change that is happening on a global scale and would have had an effect irrespective of whether development came to that corner of Africa or not.

Specificity and Sensitivity in tests

You are required to identify kids in need of remediation using a scholastic ability test.

If your test is highly specific, a low score will be able to identify everyone that requires remediation. – A lack of specificity indicates that some kids who require remediation are not identified.

If your test is highly sensitive, then a high score will clearly exclude anyone that does not need remediation.

SPIN and SNOUT are commonly used mnemonics which helps to remind us ofthe disticntion: A highly SPecific test, when Positive, rules IN disease (SP-P-IN), and a highly ‘SeNsitive’ test, when Negative rules OUT disease (SN-N-OUT)

Questioning the archaic…

We had a debate in our office the other day as to the proper use of spacing after a fullstop. Some of my colleagues insisted that double spacing after a fullstop was the proper way to type whilst others insisted on single spacing. A couple of opinion polls later, I started checking some style manuals and the opinion of the typographers. The jury is not out on this anymore – If you type on a modern computer, single space is what you should use.

Apparently people who type two spaces, were taught by people who were taught by people who learned to type on typewriters that only allowed monospacing – i.e. an “l” and an “m”, despite being different in size, was given the same amount of space, because typewriters couldn’t work differently. This resulted in lots of white space in the middle of words, hence the need for double spacing between senences. With the introduction of computers, almost all texts are now created in proportional fonts – so the narrower characters take less space, and you don’t need a double space after a full stop.

But this got me thinking – How much of what we do as evaluators and researchers do we do just because we were taught by people who had to make use of old archaic technology to get the job done? I mean, think about it – Why do we still insist that the primary output from an evaluation should be a report? Or… hold on to your seat… a PowerPoint presentation?

If use of evaluations (or information) depends on the degree to which the findings are communicated concisely, then we should be building our communications capability and get creative. If you look at the capabilities that simple Mac Software like Keynote offers (and I’m no expert) then really! There is so much more that we should be doing

I share with you three examples of what I would like to see more of:

Hans Roslin inspires with visualization of statistics (This guy rocks!):
http://ow.ly/47WDV

This “Story of Stuff” clip combines presentation, story telling and animation in really interesting ways
http://ow.ly/47WIh

And Here is how a normal presentation with some voice can help to get the message across, a lot better than just a PowerPoint presentation
http://ow.ly/47WOA

Survey Design

I’m working on a retrospective pre-post competency survey, and needed to be reminded of some basics of survey design again.

I find Neuman’s chapter about survey design a good foundation: http://www.amazon.com/gp/product/0205457932.

Jane Davidson Makes some compelling arguments that suggest that we do need to think twice when we decide to make use of Likert type scales in surveys. http://genuineevaluation.com/breaking-out-of-the-likert-scale-trap/
She sugggests that rather than use the “strongly agree / disagree” type anchors, one could use evaluative terms like “inadequate / good” that might make the data easier to interpret.

Ive also found a list of possible Likert Scale Anchors that are most useful:
http://www.hehd.clemson.edu/prtm/trmcenter/scale.pdf

Why Competency Self Assessments are essentially flawed beyond redemption

I’m working on an evaluation to determine if a training programme for senior government managers makes a difference – In the competence level of the managers, and in the service delivery they are able to produce within their work context. We are tracking a wide evidence base about all of the participants, but the client is insistent that a competency self-assessment be included. We agreed, on the condition that this one piece of evidence will be used together with all of the other evidence we will be collecting throughout the study. The value that the competency self-assessment will add, is something we have debated in the team. The following entertaining post by Errol Morris, however, pretty much sums it all up:

http://opinionator.blogs.nytimes.com/2010/06/20/the-anosognosics-dilemma-1/

David Dunning, a Cornell professor of social psychology… wondered whether it was possible to measure one’s self-assessed level of competence against something a little more objective — say, actual competence. Within weeks, he and his graduate student, Justin Kruger, had organized a program of research. Their paper, “Unskilled and Unaware of It: How Difficulties of Recognizing One’s Own Incompetence Lead to Inflated Self-assessments,” was published in 1999.

Dunning and Kruger argued in their paper, “When people are incompetent in the strategies they adopt to achieve success and satisfaction, they suffer a dual burden: Not only do they reach erroneous conclusions and make unfortunate choices, but their incompetence robs them of the ability to realize it. Instead, …they are left with the erroneous impression they are doing just fine.”
It became known as the Dunning-Kruger Effect — our incompetence masks our ability to recognize our incompetence.

There have been many psychological studies that tell us what we see and what we hear is shaped by our preferences, our wishes, our fears, our desires and so forth. We literally see the world the way we want to see it. But the Dunning-Kruger effect suggests that there is a problem beyond that. Even if you are just the most honest, impartial person that you could be, you would still have a problem — namely, when your knowledge or expertise is imperfect, you really don’t know it. Left to your own devices, you just don’t know it. We’re not very good at knowing what we don’t know

In logical reasoning, in parenting, in management, problem solving, the skills you use to produce the right answer are exactly the same skills you use to evaluate the answer

Can a song cause someone’s death?

A quantitative evaluator, a qualitative evaluator, and a normal person are waiting for a bus. The normal person suddenly shouts, “Watch out, the bus is out of control and heading right for us! We will surely be killed!”
Without looking up from his newspaper, the quantitative evaluator calmly responds, “That is an awfully strong causal claim you are making. There is anecdotal evidence to suggest that buses can kill people, but the research does not bear this out. People ride buses all the time and they are rarely killed by them. The correlation between riding buses and being killed by them is very nearly zero. I defy you to produce any credible evidence that buses pose a significant danger. It would really be an extraordinary thing if we were killed by a bus. I wouldn’t worry.”

Dismayed, the normal person starts gesticulating and shouting, “But there is a bus! A particular bus! That bus! And it is heading directly toward some particular people! Us! And I am quite certain that it will hit us, and if it hits us it will undoubtedly kill us!” At this point the qualitative evaluator, who was observing this exchange from a safe distance, interjects, “What exactly do you mean by bus? After all, we all construct our own understanding of that very fluid concept. For some, the bus is a mere machine, for others it is what connects them to their work, their school, the ones they love. I mean, have you ever sat down and really considered the bus-ness of it all? It is quite immense, I assure you. I hope I am not being too forward, but may I be a critical friend for just a moment? I don’t think you’ve really thought this whole bus thing out. It would be a pity to go about pushing the sort of simple linear logic that connects something as conceptually complex as a bus to an outcome as one dimensional as death.”

Very dismayed, the normal person runs away screaming, the bus collides with the quantitative and qualitative evaluators, and it kills both instantly…Very, very dismayed, the normal person begins pleading with a bystander, “I told them the bus would kill them. The bus did kill them. I feel awful. To which the bystander replies, “Tut tut, my good man. I am a statistician and I can tell you for a fact that with a sample size of 2 and no proper control group, how could we possibly conclude that it was the bus that did them in?”

* On that note, however, I reject all the talk that the singing of a song CAUSED the death of a man. It may have been a contributor, but I doubt it was either a necessary or sufficient circumstance for this specific death!

http://www.news24.com/SouthAfrica/News/Spike-in-race-tensions-institute-20100406

A lonely brainstorm… Or many minds?

A grantmaking organization (our client) is interested in evaluating the level of their service delivery and relationship management – as perceived by the grantees that they disburse funds to. So here is the question – What are the evaluation standards that we should use?

Grantee perceptions?
The terms of reference indicates that the client expects that the evaluators will interact with the grantees to answer their questions. But if we ask grantees what they think of the grant maker’s processes, approach, involvement, communication etc. we might get senseless data because the wide range of grantees will have very different expectations about what qualifies as good service delivery / relationship management. It will probably be easy to collect data about their perceptions, but that won’t be very useful. And then there is also the issue of possible bias: Those grantees that experienced difficulty in submitting reports etc for monitoring purposes, might actually be slightly more negative than the rest of the grantees that would probably be eager to be complement the people that will dish out their next pay check.

The Grantmakers’ own standards?
It might make sense to determine whether the grantmaker has any implicit or explicit service delivery standards or contracted agreements that could be used as the standard to evaluate their performance against. But if the grantmaker has a standard that says: “All applications must be acknowledged in writing within 6 months from the date of receipt” that would be easy to check, but surely that service standard seems a little odd? Does it really take six months to respond to a submission?

Industry standards and benchmarks?
The alternative would be to look at service delivery standards and benchmarks as set by other industry players. There’s lots of literature about grantmaking internationally, but information about South African grantmakers are limited – There is the CSI handbook, but it doesn’t contain the level of detail that may be required to develop an extensive set of evaluation standards and benchmarks. And grant makers are notoriously secretive about their approach, systems and quality standards, so we will probably not be able to get detailed information from more than a handful of players in the field that we have established past relationships with.

Room for a participatory agreement on what exactly should be measured?
It is possible that a rigorous engagement of grantees and grant makers at the outset of the evaluation could provide the most satisfactory solution to the “which standards should we use” question. And that is probably just what we will do! Background research about all of the above will probably provide a good basis to start the workshop, but it will be interesting to see what the final consensus will dictate!

Visualization Methods – Really really interesting

Previously I wrote about Edward Tufte’s Book on presenting graphs. Well, it seems that data visualization has been taken to a whole new level.

Ralph Lengler & Martin J. Eppler form the Institute of Corporate Communication compiled a “Periodic table” of visualization methods that categorizes and shows examples of about 100 visualization methods.

The table can be downloaded in pdf format at:
http://www.visual-literacy.org/periodic_table/periodic_table_as_pdf.pdf

But try the online version – As you mouse over the various “elements” an example pops up to demonstrate what it looks like.
http://ow.ly/v9RI

The full article explaining the table can be found at
http://ow.ly/wk7d

Wow – It takes people specializing in visualization methods to think of such an innovative way to present their concept.

PS. I heard about this on the American Evaluation Assocation’s Linked in Group.This and other useful information gets shared from time to time.

Get involved – SAMEA is preparing a submission

Media statement by the Minister in the Presidency T Manuel for National Planning on the release of the Green Paper on National Strategic Planning
4 September 2009

Today government is releasing two discussion documents, one a Green Paper on National Strategic Planning and the other a Policy Document on Performance Monitoring and Evaluation. The decision by President Zuma to appoint Ministers in the Presidency responsible for National Planning and Performance Monitoring and Evaluation is designed to improve the overall effectiveness of government, enabling government to better meets its development objectives in both the short- and longer-term. These two discussion documents must be seen in the context of wider efforts led by the President to improve the performance of government through enhancing coherence and co-ordination in government, managing the performance of the state and communicating better with the public.
The Green Paper on National Strategic Planning is a discussion document that outlines the tasks of the national planning function, broadly defined. It deals with the concept of national strategic planning, as well as processes and structures. Once consultations on these issues have been completed, the process to set up the high-level structures will commence; and this will be followed by intense work to develop South Africa’s long-term vision and other outputs. In other words, the Green Paper does not deal with these substantive issues of content.
The rationale for planning is that government (and indeed the nation at large) requires a longer-term perspective to enhance policy coherence and to help guide shorter term policy trade-offs. The development of a long-term plan for the country will help government departments and entities across all the spheres of government to develop programmes and operational plans to meet society’s broader developmental objectives. Such a plan must articulate the type of society we seek to create and outline the path towards a more inclusive society where the fruits of development benefit all South Africans, particularly the poor.
The planning function is to be coordinated by the Minister in The Presidency for National Planning. There are four key outputs of the planning function. Firstly, to develop a long term vision for South Africa, Vision 2025, which would be an articulation of our national aspirations regarding the society we seek and which would help us confront the key challenges and trade-offs required to achieve those goals. A National Planning Commission comprising of external commissioners who are experts in relevant fields would play a key role in developing this plan. The development of a National Plan would require broader societal consultation and existing forums would be used for this purpose. The Minister in The Presidency will co-ordinate these engagements. A National Plan has to be adopted by Cabinet for it to have the force of a government plan. The Minister would serve as a link between the Commission and Government, feeding the work of the Commission into government.
The next set of outputs cover the five-yearly Medium Term Strategic Framework (MTSF) and the National Programme of Action. These are documents of national government, adopted by Cabinet, drawing on the electoral mandate of the government of the day. The Minister in The Presidency for National Planning, supported by a Ministerial Committee on Planning, would coordinate the development of these documents with input from Ministers, departments, provinces, organised local government, public entities and coordinating clusters.
Further, it is envisaged that the planning function in The Presidency will undertake research and release discussion papers on a range of topics that impact on long-term development. These include topics such as demographic trends, global climate change, human resource development, and future energy mix and food security. The Presidency would also release and process baseline data on critical such as demographics, biodiversity as well as migratory and economic trends. This work will be undertaken by the Minister, working with the National Planning Commission (NPC) and the Minister, working with the NPC would, from time to time, advise government on progress in implementing the national plan, including the identification of institutional and other blockages to its implementation.
One of the functions of The Presidency in respect of national planning is to develop frameworks for spatial planning that seek to undo the damage that apartheid’s spatial development patterns have wrought on our society. This includes the development of high level frameworks to guide regional planning and infrastructure investment.
The national planning function will provide guidance on the allocation of resources and in the development of departmental, sectoral, provincial and municipal plans.
The Minister in The Presidency responsible for national planning will be supported by a Planning Secretariat, which will also provide administrative, research and other support to the National Planning Commission. National Strategic Planning is an iterative process involving extensive consultation and engagement within government and with broader society.
It is envisaged that Parliament will play a key role in guiding the planning function through its oversight role but also through facilitating broader stakeholder input into the planning process. For this reason, it is appropriate that Parliament should lead the discussion process on the Green Paper.
This Green Paper is a discussion document. Government welcomes comment, advice, criticisms and suggestions from all in society.
Please address all comments on the Green Paper on National Strategic Planning to the Minister in the Presidency for National Planning c/o:
Hassen Mohamed
E-mail: hassen@po.gov.za
Tel: 012 300 5455
Fax: 086 683 5455
Issued by: The Presidency
4 September 2009

Please see http://www.info.gov.za/speeches/2009/09090414151003.htm for the actual green paper and Policy document on performance monitoring and evaluation.

Check out the GOODs

A colleague referred me to a refreshing website that might be interesting to do-gooders the world over. It is called GOOD.

Maybe they called it GOOD because it can be found at the following url: http://www.good.is/. Apparently “GOOD is a collaboration of individuals, businesses, and nonprofits pushing the world forward”

Maybe they called it GOOD because it is good. I remind you, dear reader, that I am an evaluator so I should – according to the Scrivenian* wisdom I sometimes subscribe to – be particularly well placed to pass judgements about merit and worth. However, I will reserve judgement about the Goodness of GOOD for now. Except for saying what I have already said about it.

There is an interesting blog about Innovation and Evaluation in philanthropy. See

http://www.good.is/post/innovation-and-evaluation-are-inseparable/

*OK, that only sounded GOOD in my head, but the meaning I’m hoping to convey is that Michael Scriven’s writings are relevant here.

ELDIS RESOURCE

http://www.eldis.org/go/topics/resource-guides/manuals-and-toolkits/monitoring-and-evaluation

The Eldis Community site enables development professionals across the world to debate, discuss and exchange ideas and information. This community group, focusing on results-based M&E, is composed of development evaluation practitioners committed to evaluation capacity building at all levels of human development activities – global, country or community level; policy, programme or project level – with the aim of bringing about an equitable, accountable and progressive society for everyone.

Social Capital is a fundamental requirement for associations to work.

The IOCE has an EvaLeaders listserve which aims to connect key people across the worlds’ evaluation associations. I took up the task of trying to think of something to do to get the discussion going. We settled for a “monthly discussion question” and after posting the first of the questions, we were met with a resounding silence.

A variety of hypotheses were shared in order to explain the silence, the most interesting one:

“Our first question assumed that those on the EvaLeaders list share a sense of community with leaders of other IOCE member evaluation associations, and thus would be willing to take the time to write something about what their group is up to… the reality check is that there is a long-term process involved”.

Concepts like “Evaluation Community” and “Community of Practice” are frequently used when speaking about Evaluation Associations, but I certainly have not sat down to think of what this actually means in practice. I have not really come to terms with the fact that social capital is inherent in working networks… capital in all shapes and sizes are requried for a network to work. In a working network, more social capital is also easily created.

Evaluation Associations are social networks, and although we typically evaluate an association’s effectiveness by the number of activities they present and by the size of their membership, the true value of an association is actually in the strength of the links between members. Its these links that make shared values and common activities possible. If something as abstract as “hapiness” can dynamically spread through social networks*, then surely values, knowledge and a whole host of other fuzzy, yet potentially important evaluation-aligned attributes can be transferred too.

The question is: How do you get the minimum social capital together to start a vibrant network? Are there social-capital loans available from the World Bank? How many in-kind donations would be required? 🙂

I’m afraid I have more questions than answers to ponder…

*”Dynamic spread of happiness in a large social network: longitudinal analysis ver 20 years in the Framingham Heart Study” written by James Fowled and Nicholas Christakis. (BMJ 2008;337:a2338 doi:10.1136/bmj.a2338)

Participatory Evaluation Design

I’m planning an evaluation planning meeting during which the intended evaluation users will design an organizational capacity evaluation. The organizations under scrutiny deliver services to the disabled (Or is the correct term “differently Abled”?). We will start with “drawing the road” (Ross Connor recently did a presentation on this at the Lisbon EES Conference) followed by the development of a stakeholder map, clarification of evaluation questions and the development of an evaluation matrix.

The evaluation matrix will outline the final evaluation questions, indicate which stakeholder need it addresses, and will also identify the data collection method and source. As a quality control exercise I’m planning to give the team a checklist that would ask the members whether the planned data collection meets some basic evaluation principles.

Some of the principles that I will try to incorporate:
• Independence: You cannot ask the same person in whose compliance you are interested, whether they are complying. The incentive to provide false information might be very high. You can ask school principals about the degree to which the Province has met their commitments, and you can ask parents whether the school charges money, but you cannot ask the school principal whether they are charging school fees if they have been declared a no-fee school.
• Relevance: Appropriate questions must be asked. You cannot expect a member of the general public (e.g. a parent) if the school is complying with the school funding norms – He / she is unlikely to know what these entail.
• Consider Systemic Impacts. Look broader than just the cases directly affected. No fee schools are not the only ones likely to be impacted by this specific policy provision. The schools in the area are also likely to be affected in some way.
• Appropriate Samples need to be selected. The sampling approach, sample size are all related to the question that needs to be answered.
• Appropriate methods need to be selected. Although certain designs are likely to results in easy answers, they might not be appropriate
• Implementation Phase: Take into account the level of implementation when you do the assessment. It is well known that after initial implementation an implementation dip might occur. Do not try to do an impact assessment when the level of implementation has not yet stabilised in the system.
• Fidelity: Take into account the fidelity of implementation, i.e to what degree the policy was implemented as it was intended.
• Quality Focus: Although a specific funding policy might have as a major aim to improve access to services, quality should always be a consideration. It is no use you have increased access to a service that never before delivered quality outputs, outcomes and impacts. Similarly it is no use that access to a good quality service improved, but due to the increased up-take of the service, the quality were negatively impacted.

I’ll provide some feedback after the workshop

GDE Colloquium on their M&E Framework

Recently the Gauteng Department of Education held a colloquium on their Monitoring and Evaluation Framework. As one of the speakers, I reflected on the fact that M&E frameworks often erroneously assume that the evaluand is a stable system. I argued that there are multiple triggers that leads to the evolution of the evaluand and that this has implications for M&E.

Triggers for evolving systems, organizations, policies, programmes & interventions
(Morell, J.A. (2005). Why are there unintended consequences of program action, and what are the implications for doing evaluation? In American Journal of Evaluation 2005 (26) p 444 – 463 )
• Unforeseen consequences
– Weak application of analytical frameworks, failure to capture experience of past research
• Unforeseeable consequences
– Changing environments
• Overlooked consequences
– Known consequences are ignored for practical, political or ideological reasons
• Learning & Adapting
– As implementation happens, the learning is used to adapt
• Selection Effects
– If different approaches are tried, those that are successful are likely to be replicated and those that are unsuccessful are unlikely to be replicated.

Implications for M&E
• M&E needs to work in aid of evolution (not just change)
– The M&E framework should be key in allowing the GDE to adapt, learn, respond to changes
• Not just by ensuring that the right information is tracked, but to ensure that the right people have access to it at the right time.
• M&E needs to respond to evolution
– As the Evaluand changes, some indicators will be incorrectly focused or missing, so the framework will have to be updated periodically
– It might be necessary to implement measures that go beyond checking “whether the Dept makes progress towards reaching its goals and objectives”
• Diversity of input into the design of the framework
• Using appropriate evaluation methods
– Consider expected impacts of change in planning for roll-out of M&E

Critical analysis of an M&E framework
• Does it ask the right questions in order for us to judge the merit, worth or value” of that which we are monitoring / evaluating?
• Does it allow for credible & reliable evidence to be used?

Types of Questions to ask
(Chelimsky, E. (2007). Factors Influencing the Choice of Methods in Federal Evaluation Practice. New Directions for Evaluation 113. p 13 – 33)

• Descriptive questions: Questions that focus on determining how many, what proportion etc. for the purposes of describing some aspect of the education context. (e.g. if you were interested in finding out what the drop out rate for no-fee schools is)
• Normative questions: Questions that compare outcomes of an intervention (such as the implementation of new policies) against a pre-existing standard or norm. Norm referenced questions can use various standards to compare against:
– Previous measures for the group that’s exposed to the policy intervention (e.g. if you compare the current drop-out rate to the previous drop-out rate for a specific set of schools affected by the policy)
– A widely negotiated and accepted standard (e.g. if it was accepted that a 5% drop out rate is acceptable, you can check whether the schools currently have that drop-out rate or not)
– Measure from another similar group (e.g. if you compare the drop-out rate for different types of schools)
• Attributive questions: Questions that attempt to attribute outcomes directly to an intervention like a policy change or a programme (Is the change in the drop-out rate in no-fee schools due to the implementation of the no-fee school policy)
• Analytic-Interpretive questions that builds our Knowledge base: Questions that ask about the state of the debate issues important for decision making about specific policies. (e.g. What is known about the relationship between drop-out rate and the per-learner education spend of the Department of Education)

Questions at different Time Periods
• Prior to implementation:
– Q1.1: What does available baseline data tell us about the current situation in the entities that will be affected? (Descriptive)
– Q1.2: Given what we know about existing circumstances and the changes proposed when the new policy / programme is implemented, what are the likely impacts/ effects likely to be? (Analytic-Interpretive, Normative)
• Evidence based policy making requires some sort of ex-ante assessment of the likely changes. This assessment can then later be referred to again when the final impact evaluation is conducted.

• Directly after implementation, and continued until full compliance is reached:
– Q2.1: To what degree is there compliance to the policy / fidelity to the programme design? (Descriptive)
– Q2.2: What are the short term positive and negative effects of the policy change / programme? (Descriptive, Normative and Attributive)
– Q2.3: How can the implementation and compliance be improved? (Analytic-Interpretive)
– Q2.4: How can the negative short term effects be mitigated? (Analytic-Interpretive)
– Q2.5: How can the positive short term effects be bolstered? (Analytic-Interpretive)
• This is important because no impact assessment can be done if the policy / programme has not been implemented properly, if there are significant barriers to the implementation of the policy / programme an intervention to remove these barriers would be necessary or the policy / programme should be changed.

• After compliance has been reached and the longer term effects of the policy are able to be discerned:
– Q3.1: To what degree did the policy achieve what it set out to do? (Normative)
– Q3.2: What has been the longer term and systemic effects attributable to the policy change? (Descriptive, Normative, Attributive)
– Q3.3: How can the implementation be improved / negative effects be mitigated / positive effects be bolstered? (Analytic-Interpretive)
• This is important to demonstrate that policy change was effective in addressing the underlying issues initially requiring the policy change, and to check that no unintended perversions of the policy became implemented.

• Designs appropriate to Descriptive questions:
– CASE STUDY DESIGNS
– RAPID APPRAISAL DESIGNS
– GROUNDED THEORY DESIGNS
• Designs Appropriate to Analytic-Interpretive questions
– LITERATURE REVIEW
– MIXED METHOD DESIGNS
• Designs Appropriate to Normative questions
– TIME SERIES RESEARCH DESIGNS
• Designs Appropriate to Attributive questions
– EXPERIMENTAL DESIGNS
– QUASI-EXPERIMENTAL DESIGNS

Principles for Evidence Collection
• Independence: You cannot ask the same person in whose compliance you are interested, whether they are complying. The incentive to provide false information might be very high.
• Relevance: Appropriate questions must be asked of the right persons..
• Consider Systemic Impacts. Look broader than just the cases directly affected.
• Appropriate Samples need to be selected. The sampling approach, sample size are all related to the question that needs to be answered.
• Appropriate methods need to be selected. Although certain designs are likely to results in easy answers, they might not be appropriate
• Implementation Phase: Take into account the level of implementation when you do the assessment. It is well known that after initial implementation an implementation dip might occur. Do not try to do an impact assessment when the level of implementation has not yet stabilised in the system.
• Fidelity: Take into account the fidelity of implementation, i.e to what degree the policy was implemented as it was intended.

Metrics for Social Entrepreneurs

I found this website aimed at social entrepreneurs quite useful.
http://www.socialedge.org/discussions/success-metrics/new-metrics-for-today-s-social-entrepreneurs/

It lists some approaches for measurement:
“Social entrepreneurs now have a smorgasbord of measurement methodologies to choose from in addition to developing project-specific metrics (i.e., families served, reduction in arrests, units built, jobs created). They include:

• Balanced Scorecard Methodology (New Profit Inc.)
• The Acumen-Mckinsey Scorecard (Acumen Fund)
• Social Return Assessment Scorecard (Pacific Community Ventures)
• AtKisson Compass Assessment for Investors (AtKisson)
• Poverty and Social Impact Analysis (World Bank)
• OASIS: Ongoing Assessment of Social Impacts (REDF)”

They also extract Five principles of metrics that are often mentioned in discussions

1. Do have a set of success metrics
Funders and investors want to know that you have a way of measuring your success.
2. Tailor your metrics to your mission
If you are running a non-profit, then focus on social impact; if you are running a for-profit, you need the third bottom line – ROI.
3. Measure what you can in real time, but understand that social change is often measurable only over a longer period.
Try to find polling and survey organizations that are measuring the long-term trends and use their free published data.
4. Learn about established methodologies for social measurements
Applying them will save you work, get better results, and signal investors that you are serious about metrics.
5. Look at the cost-benefit of your metrics
Determine what percentage of your operations should be reasonably dedicated to success measurement and set it aside in your proposal and operating budgets.

Personally, I think that the issue of Return on Investment is crucial for any social entrepreneur. You need to be able to prove to your donors that they are getting value for money – Too many times teachers are trained at the cost of training and astronaut.

The Global Classroom – Direct from Claremont Graduate University

This very useful resource was brought under my attention via the AEA and SAMEA listservs.

The panel discussions from Claremont Graduate University ‘s recent “What Works?” workshops are available for viewing online as part of our video library. Evaluators, foundation directors, academics, and leaders of successful for-profits and non-profits came together to discuss what really works when tackling important social problems.

To view this footage, visit us at: http://www.cgu.edu/pages/5243.asp.

To view many other talks on evaluation and topics in applied psychology, visit our full video library at http://www.cgu.edu/pages/4435.asp.

Taxonomy of Evaluation

I found the Evaluation Webring’s Taxonomy of Types, Approaches and Fields of Evaluation Quite Useful.

Category 1: Types of evaluation
Internal evaluation or self- evaluation
An evaluation carried out by members of the organisation(s) who are associated with the programme, intervention or activity to be evaluated.

Ex-ante evaluation or impact assessment
An assessment which seeks to predict the likelihood of achieving the intended results of a programme or intervention or to forecast its unintended effects. This is conducted before the programme or intervention is formally adopted or started. Common examples of ex-ante evaluation are environmental and/or social impact assessments and feasibility studies.

Mid-term or interim evaluation
An evaluation conducted half-way through the lifecycle of the programme or intervention to be evaluated. Monitoring An ongoing activity aimed at assessing whether the programme or intervention is implemented in a way that is consistent with its design and plan and is achieving its intended results.

Ex-post or summative evaluation
An evaluation which usually is conducted some time after the programme or intervention has been completed or fully implemented. Generally its purpose is to study how well the intervention served its aims, and to draw lessons for similar
interventions in the future.

Meta-evaluation
Two processes are often referred to as meta-evaluation: (1) the assessment by a third evaluator of evaluation reports prepared by other evaluators; and (2) the assessment of the performance of systems and processes of evaluation.

Formative evaluation
An evaluation which is designed to provide some early insights into a programme or intervention to inform management and staff about the components that are working and those that need to be changed in order to achieve the intended objectives.

Category 2: Evaluative approaches
Outcome evaluation
An evaluation which is focused on the change brought about by the programme or intervention to be evaluated or its results regarding the intended beneficiaries.
Impact evaluation An evaluation that focuses on the broad, longer-term impact or effects, whether intended or unintended, of a programme or intervention. It is usually done some time after the programme or intervention has been completed.

Performance evaluation
An analysis undertaken at a given point in time to compare actual performance with that planned in terms of both resource utilization and achievement of objectives. This is generally used to redirect efforts and resources and to redesign structures.

Participatory evaluation
An evaluation that actively involves all or selected stakeholders in the evaluation process. Different approaches involve varying degrees of participation, inclusion, capacity-building, ownership, etc.

Empowerment evaluation
An approach that aims to improve programs through using specific tools for assessing the planning, implementation and self-evaluation of programs, and by incorporating evaluation into a program or organization’s planning and management. It involves a high level of participation by stakeholders in the evaluation process and is guided by ten key principles.
Collaborative evaluation An evaluation which aims for a significant degree of collaboration or cooperation between evaluators and stakeholders.

Utilization-focused evaluation
A process that assists the primary intended users of an evaluation to select the most appropriate content, model, methods, and theory for the evaluation, focusing on their intended use of the evaluation. Use refers to how people apply evaluation findings and experience the evaluation process.

Feminist evaluation
An evaluation that commonly involves adapting or redesigning relevant evaluation theories and methodologies so that they are compatible with feminist theories and methodologies. Feminist evaluations aim to be inclusive and empowering for women in particular.

Theory-based evaluation
An evaluation based on the theories of change that underlie a given programme or intervention. Its major aim is to examine the extent to which these theories hold and to validate their underlying assumptions.

Most Significant Change
A form of participatory monitoring and evaluation which involves the collection and systematic review and analysis of change stories by panels of designated stakeholders or staff. It is mainly used to assess intermediate program impacts and outcomes.

Category 3) Fields of evaluation

Programme or project evaluation
The evaluation of a programme or project.

Policy evaluation
The evaluation of policies and procedures.

Evaluation of legislation
The evaluation of a piece of legislation.

Evaluation of technical assistance
The evaluation of technical assistance provided by international, bilateral or multilateral donors.

Organisation or institutional evaluation
An evaluation of an organization’s or other institution’s capacity for innovation and change. It involves examining its decision-making processes and organisational structures.

Proposal assessment
The assessment of bids presented by tenderers following a specific call for tenders/bids.
Financial audit The scrutiny of accounts of an organization or other institution against a set of standards.

Personnel evaluation
A systematic method of evaluating an employee’s or staff member’s performance. This involves tracking, evaluating and providing feedback in relation to specific predetermined standards which are consistent with the organization’s overall

Surveys – Should we believe them?

There is a lot written about survey methodology as a tool in evaluation, but despite the easy and neat stats that they deliver, one should regard them with a little bit of skepticism, it seems.

Two stories to demonstrate the point:

According to a speaker on 702 talk radio I heard earlier this week, Volkskas bank still receives votes for one of the best brands in South Africa (in the Annual Markinor survey), despite the fact that it has ceased existence now for more than just a couple of years. At least in this survey, you can identify problematic answers because survey respondents had the option of giving an open-ended answer. I shudder to think what people actually do when they get one of those tick box multiple choice surveys…

In the next example, it is just so clear that one should question even the most basic assumptions people make when they complete a survey.

http://news.yahoo.com/s/afp/20080204/wl_uk_afp/britainpeoplehistoryoffbeat_080204001239
LONDON (AFP) – Britons are losing their grip on reality, according to a poll out Monday which showed that nearly a quarter think Winston Churchill was a myth while the majority reckon Sherlock Holmes was real. The survey found that 47 percent thought the 12th century English king Richard the Lionheart was a myth. And 23 percent thought World War II prime minister Churchill was made up. The same percentage thought Crimean War nurse Florence Nightingale did not actually exist.Three percent thought Charles Dickens, one of Britain’s most famous writers, is a work of fiction himself. Indian political leader Mahatma Gandhi and Battle of Waterloo victor the Duke of Wellington also appeared in the top 10 of people thought to be myths. Meanwhile, 58 percent thought Sir Arthur Conan Doyle’s fictional detective Holmes actually existed; 33 percent thought the same of W. E. Johns’ fictional pilot and adventurer Biggles.

competencies/capabilities of an evaluator

Q: Do you know of a document that articulates competencies/capabilities of an evaluator? If you do please send me a reference or copy.

A: Lots of work has been done on this topic by various Evaluation Associations across the world. Some useful references:

King, Jean, Stevahn, Laurie, Ghere, Gail, & Minnema, Jane (2001). Toward a taxonomy of essential evaluator competencies. American Journal of Evaluation, 22, 229-247.

Mertens, Donna M. (1994). Training evaluators: Unique skills and knowledge. New Directions for Program Evaluation, 62, 17-27.

Treasure Board of Canada Competency Profile for Federal Public Service Evaluation Professionalshttp://www.tbs-sct.gc.ca/eval/dev/Professionalism/profession_e.asp

Here is the list:

Essential Competencies for Program Evaluators (ECPE)

(Stevahn and King, Ghere, & Minnema, American Journal of Evaluation, March

2005)

1.0 Professional Practice

1.1 Applies professional evaluation standards

1.2 Acts ethically and strives for integrity and honesty in conducting evaluations

1.3 Conveys personal evaluation approaches and skills to potential clients

1.4 Respects clients, respondents, program participants, and other stakeholders

1.5 Considers the general and public welfare in evaluation practice

1.6 Contributes to the knowledge base of evaluation


2.0 Systematic Inquiry

2.1 Understands the knowledge base of evaluation (terms, concepts, theories, assumptions)

2.2 Knowledgeable about quantitative methods

2.3 Knowledgeable about qualitative methods

2.4 Knowledgeable about mixed methods

2.5 Conducts literature reviews

2.6 Specifies program theory

2.7 Frames evaluation questions

2.8 Develops evaluation designs

2.9 Identifies data sources

2.10 Collects data

2.11 Assesses validity of data

2.12 Assesses reliability of data

2.13 Analyzes data

2.14 Interprets data

2.15 Makes judgments

2.16 Develops recommendations

2.17 Provides rationales for decisions throughout the evaluation

2.18 Reports evaluation procedures and results

2.19 Notes strengths and limitations of the evaluation

2.20 Conducts meta-evaluations


3.0 Situational Analysis

3.1 Describes the program

3.2 Determines program evaluability

3.3 Identifies the interests of relevant stakeholders

3.4 Serves the information needs of intended users

3.5 Addresses conflicts

3.6 Examines the organizational context of the evaluation

3.7 Analyzes the political considerations relevant to the evaluation

3.8 Attends to issues of evaluation use

3.9 Attends to issues of organizational change

3.10 Respects the uniqueness of the evaluation site and client

3.11 Remains open to input from others

3.12 Modifies the study as needed


4.0 Project Management

4.1 Responds to requests for proposals

4.2 Negotiates with clients before the evaluation begins

4.3 Writes formal agreements

4.4 Communicates with clients throughout the evaluation process

4.5 Budgets an evaluation

4.6 Justifies cost given information needs

4.7 Identifies needed resources for evaluation, such as information, expertise, personnel, instruments

4.8 Uses appropriate technology

4.9 Supervises others involved in conducting the evaluation

4.10 Trains others involved in conducting the evaluation

4.11 Conducts the evaluation in a nondisruptive manner

4.12 Presents work in a timely manner


5.0 Reflective Practice

5.1 Aware of self as an evaluator (knowledge, skills, dispositions)

5.2 Reflects on personal evaluation practice (competencies and areas for growth)

5.3 Pursues professional development in evaluation

5.4 Pursues professional development in relevant content areas

5.5 Builds professional relationships to enhance evaluation practice


6.0 Interpersonal Competence

6.1 Uses written communication skills

6.2 Uses verbal/listening communication skills

6.3 Uses negotiation skills

6.4 Uses conflict resolution skills

6.5 Facilitates constructive interpersonal interaction (teamwork, group facilitation, processing)

6.6 Demonstrates cross-cultural competence

M&E for Philanthropy

The following shows what makes it so difficult to work with charities!

2 Young Hedge-Fund Veterans Stir Up the World of Philanthropy

By STEPHANIE STROM
Published: December 20, 2007

Holden Karnofsky and Elie Hassenfeld rank charities by analyzing the numbers in much the same way they did at their investment management company
http://www.nytimes.com/2007/12/20/us/20charity.html?ex=1355893200&en=a0d9a701ad60ffd0&ei=5124&partner=permalink&exprod=permalink

In the fall of 2006, they and six colleagues created what Mr. Karnofsky calls a “charity club.” Each member was assigned to research charities working in a specific field and report back on those that achieved the best results. They were stunned by the paucity of information they could collect.

“I got lots of marketing materials from the charities, which look nice, you know, pictures of sheep looking happy and children looking happy, but otherwise are pretty useless,” said Jason Rotenberg, a former member of the club and now a $50,000 donor to the Clear Fund. “It didn’t seem like a reasonable way of deciding between one charity and another.”

GiveWell’s findings are available on the Internet, without charge, at www.givewell.net. In evaluating charities, Mr. Karnofsky and Mr. Hassenfeld press them for information, analyzing the numbers in much the same way they did at Bridgewater. The Smile Train, for instance, a charity that repairs cleft palates, was asked how much it spent in each region and each country to treat how many patients in each.Many in the field question how long GiveWell can survive. While 34 percent of wealthy donors who responded to a survey sponsored by the Bank of America said they wanted more information on nonprofits, almost three-quarters said they would give more if charities spent less on administration. And collecting information is costly.

As a result, most philanthropic advisory services like GiveWell have a hard time raising money. The Clear Fund has raised $300,000 since its inception this year, about half of which has gone to operating GiveWell.

The problem is that you want charities to measure impact. Although the cost of measuring is sometimes prohibitive, the potential cost of not measuring should be enough reason to make sure that you do measure.

Probability Sampling Approaches

Probability Sampling Approaches

Probability sampling approaches allow you to generalize to the full population, since it ensures that special random characteristics are likely to be distributed evenly across the units included and excluded in / from the sample. It therefore is likely to yield a less biased sample and the results could be said to apply to the full population (if the appropriate sample size was selected). Different kinds of probability sampling approaches are possible.

The figures below demonstrate the different approaches. Assume each number is a unique member of the population, assume that each group consists of discreet mutually exclusive members of the population (In columns) and assume that each cluster (delineated by a block) is a group of members in the same geographic area.

With simple random sampling the sample is selected from the whole population using a table of numbers. Note that this does not necessarily ensure balanced representation amongst different groups.

With stratified random sampling, a set number of participants from each group can be selected. Note that this does not necessarily ensure that the most economical approach is used. In the example some cases from almost all of the geographic clusters are included.

With cluster sampling, a set number of clusters are randomly selected (in this case 4) with a set number of randomly selected units within each cluster (in this case 5). Although this will be more economical in terms of fieldwork costs because travel to different clusters have been limited, it does not necessarily guarantee equal representation of groups.

With systematic sampling, a set pattern is systematically applied to select participants. In the case of the example above, every 11th member of the population were selected. Note that it did not require a random table of numbers, but were still subject to the same limitations as the simple random sample.

Type of Probability Samples

When is it applicable

Drawbacks

Simple Random Sampling (I.e.randomly select 50 schools off a list with all schools in the country)

It is ideal for statistical purposes

· It may be difficult to achieve in practice

· It requires a precise list of the whole population

· It is costly to conduct as those sampled may be spread over a wide area.

Stratified Random Sampling (I.e. Randomly select 50 schools per strata such as province)

· It ensures better coverage of the population than simple random sampling.

· It is administratively more convenient to stratify a sample – interviewers can be specifically trained to manage particular strata (e.g. age, gender, ethnic or language groups).

· Difficulty in identifying appropriate strata.

· More complex to organize and analyse results

Cluster Sampling (I.e. split the schools in a province up in geographical clusters, select 10 clusters randomly, and then proceed to visit 20 schools within each cluster)

More cost effective in terms of travel, thereby producing a reduction in the overall cost

· Units in a cluster may be very similar and therefore are less likely to represent the whole population

· Cluster sampling has a larger sampling error than simple random sampling.

Systematic Sampling (i.e. a set pattern is applied to the data set, e.g. every 11th member is selected)

It spreads the sample more uniformly over the population and is easier to conduct than simple random sampling.

The system may interact with a concealed pattern in the population.

Local monitoring of Public Service Delivery

I find the readings on the pelican listserve (Pelican Initiative: Platform for Evidence-based Learning & Communications for Social Change) always interesting. Today the message below was posted.

I find the description of Social Auditing quite interesting. At first I thought it might be similar to Social Accounting – the move of private companies to also account on the triple bottom line of Environmental, Social and Economical impacts (costs and benefits) in order to promote corporate responsibility. We’ve actually done a couple of sustainability reports using this framework. The focus, however is more on accountability than it is on changing things for improvement. Hope it is not the same for this kind of local government monitoring.

I have also previously posted something on the MSC techniques described here. I think it is quite useful if there are no clearly defined objectives to start off with, or if the social reality is very complex and requires more of a systems look at the effects. Any case. You decide for yourself!

PS. the AEA conference is on in Baltimore this week, and although I am not able to attend, my business partner is. It sounds like it is interesting and stimulating as always!

Ciao

B

**********************************************

Last month, a number of useful documents and experiences were shared by Gilles Mersadier, who is the coordinator of the FIDAfrique network (http://www.fidafrique.net/article413.html). Among the material that he shared, he referred to a methodology for capitalisation (the process of sharing experiences among and across organisations) that is being used in the context of 25 West-African rural development projects. To date, 20 of these projects have published different types of documents that are disseminated throughout the FIDAfrique network. The production of these documents, which are available on the network’s website, are supported by a methodological guide on the capitalisation process (in French and
English):
http://www.fidafrique.net/article467.html?var_recherche=capitalization

In the past few weeks, different contributions have been sent in the context of the discussion around local monitoring of public service delivery. One of the questions which we posed in the beginning of this discussion focused on the types of approaches that are being used for local monitoring purposes. In this message, I would like to briefly describe two of such approaches:

1: Social Auditing
2: Most Significant Change

**** 1: Social Auditing

The Social Auditing method has been developed and used for participatory monitoring of public service delivery by the organisation CIET (for more info on the organisation, which started in 1985 in Mexico and developed into an international network, please visit http://www.ciet.org/en/aboutciet/ ).

The method’s primary aim is to ‘increase the informed interaction between communities and public services’. The impact, coverage and costs of public services are examined through a combination of quantitative (survey) and qualitative (key informant and focus groups) evidence. The civil society plays a central role in interpreting this evidence, and through this process contributes to the creation of local solutions. The use of both ‘hard’ and ‘soft’ evidence helps to provide a strong and accurate underpinning to the locally defined ideas and solutions, and as such strengthens the legitimacy of the solutions that are developed.

A report that was published in 2005 on the use of the method for assessing ‘governance and delivery of public services’ in Pakistan lists the following seven stages of a Social Audit cycle:
(1) Clarify the strategic focus;
(2) Design sample and instruments, pilot testing;
(3) Collect information from households on use and perception of public services;
(4) Link this with information from the public services;
(5) analyse the findings in a way that points to action;
(6) Take findings back to the communities for their views about how the improve the situation;
(7) Bring evidence and community voice into discussions between service providers, planners and community representatives to plan and implement changes.

The CIET website features an extensive library section where the reports of previous social audits can be accessed, together with other experiences relating to the network’s central focus on the ‘socialisation of
evidence’:
http://www.ciet.org/en/browse/librarydocs/

**** 2: Most Significant Change

Central in the Most Significant Change (MSC) technique is – as the name suggests – the collection of significant change stories that emerge from the field level. Following the collection of these stories, those stories which are considered most significant are selected by panels of designated stakeholders or staff. The collection, discussion and further selection of the stories revolves around ‘domains’: the areas that the stakeholders collectively decide on as the focus of the monitoring. Provided that it is clear who is involved at selecting the stories at the different levels, the use of the domains makes for a transparent monitoring process. Given these characteristics, and the fact that it is relatively easy to learn how to use it, the technique can be useful in the context of local monitoring of public service delivery.

While an English guide about the technique has been available since 2005
(see: http://www.mande.co.uk/docs/MSCGuide.htm ), efforts have also been made to translate the guide into different international and local languages, including Spanish, French, Russian, Tamil and Indonesian. Rick Davies has set up a specific Web Log to make available these translations, and to allow users to share suggestions to further improve the quality of the translations. You can access this website here:

http://mscguide-translations.blogspot.com/

Our current discussion on the topic of local monitoring of public service delivery is moving towards an end, so it would be great if some of you could still share some experiences and ideas on this topic in case you did not yet have the time to do so. We will aim to send around a summary of the key points that have been contributed sometime next week.

Best wishes,
Niels

What is an Evaluator?

Do you find it difficult to explain to people what you do? Those magical two sentences that will get people to go “Aaaaaah, now I get what you do?” Unfortunately I have not been able to come up with something concrete yet. But I am still trying.

In a television interview to publicise the SAMEA conference, the DDG from the PSC Mr. Mash Dipofu tried to explain it with an example. He asked the TV presenter if he knew what the viewers thought of his programme, how it can be improved and how many people actually watches it. He explained that by answering these questions, you are doing what an evaluator would be doing and answering the underlying question: Does what I am doing have value?

Which got me thinking. So much of what we do as evaluators are also done by other professionals.

  • We are a little like investigative journalists: We talk to people and ask questions and gather information to make an argument for or argainst something. Sometimes to inform readers of some wrong doing… Sometimes we celebrate what has been achieved.
  • Then we are also a little like the weather guy. We collect numbers over a long period of time and by applying some statistical techniques we can start predicting what will happen in future.
  • Another way of looking at our job is to compare it to that of teachers. We guide people to learn from their environments – assuming that they need to be taught how to use the information at their disposal to make intelligent choices. We check with tests whether the intended result has been achieved… much like teachers check whether their students have mastered a skill or knowledge component.
  • And then of course evaluators are also a little like an auditor in the way that we try to prove to people that money has been well spent.

The problem with explaining to people what we do, is probably because people tend to confuse it with research and planning and implementation and all kinds of other things. I have also spent some time to think about how being an evaluator is different from being a researcher, a planner and an implementer.

  • Because we use research techniques to collect evidence in order to evaluate, the difference between being a researcher (who asks questions in a specific way to gather evidence) and an evaluator (who asks questions in a specific way to gather evidence to then make a value judgment about the evaluand) is sometimes a little difficult to explain. But there is a difference!
  • Planning, on the other hand comes quite naturally when you are an evaluator. After delivering an evaluation, I frequently get asked to assist in planning processes – if people value what you produced in the evaluation they want to make sure that they plan to implement the recommendations made. Being a weather guy and an auditor makes it easier to plan because you can draw info together to make predictions, and you know that you will have to explain to people why you chose to spend their money in a particular way.
  • I think evaluators will probably make terrible implementers. As an evaluator you are constantly asking questions: Is this the best way to do things? Will we achieve results? How would we know that we added value? How do we know that this is the best way forward? To implement, however, you sometimes have to say “Well I don’t know all the answers but I am making a decision to do ABC in the following way and that is the way it is!”

Despite having useful analogies to explain what evaluators do and don’t do, I think that we are at risk if we, as practitioners of a scientific metadiscipline, don’t understand how the ideology underlying evaluation is different from other those informing other jobs. Evaluators might be sharing some commonalities with teachers, weather people, auditors and journalists, but we have different values and assumptions guiding our work. We cannot forget that our work probably has a deeply political nature because we have to choose at some stage whose questions we will have to answer.

I found the following useful bit about evaluation approaches and the underlying philosophy, epistemology and ontology at http://www.recipeland.com/facts/Evaluation

Classification of approaches

Two classifications of evaluation approaches by House House, E. R. (1978). Assumptions underlying evaluation models. Educational Researcher. 7(3), 4-12. and Stufflebeam & Webster Stufflebeam, D. L., & Webster, W. J. (1980). An analysis of alternative approaches to evaluation. Educational Evaluation and Policy Analysis. 2(3), 5-19. can be combined into a manageable number of approaches in terms of their unique and important underlying principles.

House considers all major evaluation approaches to be based on a common ideology, liberal democracy. Important principles of this ideology include freedom of choice, the uniqueness of the individual, and empirical inquiry grounded in objectivity. He also contends they all are based on subjectivist ethics, in which ethical conduct is based on the subjective or intuitive experience of an individual or group. One form of subjectivist ethics is utilitarian, in which “the good” is determined by what maximizes some single, explicit interpretation of happiness for society as a whole. Another form of subjectivist ethics is intuitionist / pluralist, in which no single interpretation of “the good” is assumed and these interpretations need not be explicitly stated nor justified.

These ethical positions have corresponding epistemologies—philosophies of obtaining knowledge. The objectivist epistemology is associated with the utilitarian ethic. In general, it is used to acquire knowledge capable of external verification (intersubjective agreement) through publicly inspectable methods and data. The subjectivist epistemology is associated with the intuitionist/pluralist ethic. It is used to acquire new knowledge based on existing personal knowledge and experiences that are (explicit) or are not (tacit) available for public inspection.

House further divides each epistemological approach by two main political perspectives. Approaches can take an elite perspective, focusing on the interests of managers and professionals. They also can take a mass perspective, focusing on consumers and participatory approaches.

Stufflebeam and Webster place approaches into one of three groups according to their orientation toward the role of values, an ethical consideration. The political orientation promotes a positive or negative view of an object regardless of what its value actually might be. They call this pseudo-evaluation. The questions orientation includes approaches that might or might not provide answers specifically related to the value of an object. They call this quasi-evaluation. The values orientation includes approaches primarily intended to determine the value of some object. They call this true evaluation.

http://www.recipeland.com/facts/Evaluation

Rant for today*

A potential client sends out Terms of Reference requesting potential service providers to submit a quotation for an (5 maybe 10 person day) evaluation engagement. Note, they did not ask for a proposal, they asked for a quotation. Given the limited scope of the project, a quotation makes sense. So that is what I submit.

Then potential client reads through the proposals they received and *Horror* *shock* discovers that there isn’t enough information in the quotations to make a transparent decision. (Maybe there was a little problem with the Terms of Reference?) They then set up a meeting in which they expect potential service providers to present to a panel. “For the purposes of meeting with the potential evaluators and ensuring the selection process is fair and transparent”. (Have I mentioned that this is a small job?)

So I go and have a wonderful meeting with the potential client, but in the end do not get the job. My heart isn’t broken or anything. It would’ve been nice to get the job but… ah well, I think they looked for a content specialist rather than an evaluation specialist in the first place.

But hey, I am an evaluator, and evaluative thinking requires me to find out why I was not successful. So I write the “Thanks for the notification, we are disappointed, could you please tell us where our submission was weak… bla-di-blah” email. To which I don’t receive a response. I get my office manager to follow up and get a response of the kind: “We liked your presentation / Sorry we don’t have time to provide feedback / now please just leave us alone”.

What happened to the transparency and fairness thing? Am I unreasonable to think that a two line explanatory email is not much to ask after all of the trouble they put me through?

Ahem… The UK evaluation Society has some guidelines for persons when they commission evaluations at:

http://www.evaluation.org.uk/Pub_library/PRO2907%20-%20UKE.%20A5%20Guideline.pdf

Maybe more people should read that?

*Because this is my blog I get to complain here every now and again. I promise that this will not turn into those rant-upon-rant blogs, but I really need to get the following off my chest.

Whew! Its been like how long?

I see I haven’t posted anything here since April. That is probably because I have nothing to write about when I have time, and when I have time to write, I can’t think of anything to write about. So here are a list of things I would like to address at some stage:

* What people think a focus group is and what it really is
* Rapid assessment methods – differences in approaches (I need to draw up a table based on that AJE article I read yesterday)
* When people should consider appointing an evaluation specialist rather than a content specialist for certain evaluations.
* If evaluators do strategic planning, what is it that they should know about planning AND if planners or anybody else does evaluations what is it they need to know about evaluations
* People say evaluation is a meta-discipline. Why do they say that.
*All this talk about accreditation is just confusing everybody. What does it mean and what about the international body of work that has been done on this aspect?

Handy Publication: New Trends in Evaluation

You know how you always come back with a stack of stuff to read when you’ve attended an evaluation conference? It most cases the material just gets added to my ever growing “to read” pile. It is only once I start searching for something or decide to spring-clean, that I actually sit down and read some of the stuff. This morning I came across a copy of UNICEF / CEE/CIS and IPEN’s New Trends in Evaluation.

What a delightfully simple straightforward publication – yet it packs so much relevant information between its two covers. I wish I had remembered about it last week when I lectured to students at UJ. Before I was able to get on with the lecture on Participatory M&E, I first had to explain how M&E is different and similar to Social Impact Assessments (In the sense of ex-ante Environmental Impact Assessment type assessment). I think it would have been a very handy introductory source to have.

The table of contents looks as follow:

1. Why Evaluate?
The evolution of the evaluation function
The status of the evaluation function worldwide
The importance of Evaluation Associations and Networks
THe oversight and M&E function
2. How to Evaluate?
Evaluation culture: a new approach to learning and change
Democracy and Evaluation
Democratic Approach to Evalution
3. Programme Evaluation Development in the CEE/CIS

But what is really useful is the Annexures:
Annex 1: Internet Bades Discussion Groups Relevant to Evaluation
Annex 2: Internet Websites Relevant to Evaluation
Annex 3: Evaluation Training and Reference Sources Available Online
Annex 4-1: UNEG Standards for Evaluation in the UN System
Annex 4-2: UNEG Norms for Evaluation in the UN System
Annex 5: What goes into a Temrs of Reference; UNICEF evaluation Technical Notes, Issue No.2

The good thing about this publication is that you can download it for free off the internet at

http://www.unicef.org/ceecis/New_trends_Dev_EValuation.pdf

An introductory blurb and a presentation is also available from the IOCE website.

http://ioce.net/news/news_articles/061023_unicef-ipen.shtml

Presentation Presented at the SAMEA conference 26 – 30 March 2007

Based on some of the ideas in previous blog entries, I presented the following presentation at the recent SAMEA conference.

Setting Indicators and Targets for Evaluation of Education Initiatives

Introduction

  • Good Evaluation Indicators and Targets are usually an important part of a robust Monitoring and Evaluation system.
  • Although evaluation indicators are usually considered as important, all evaluations do not have to make use of a set of pre-determined indicators and targets.
  • The most significant change (MSC) technique, for example, looks for stories of significant change amongst the beneficiaries of a programme, and after the fact uses a team of people to determine which of these stories represent MSC and real impact.
  • You have to include the story around the indicators in your evaluation reports in order to learn from the findings.

What do we mean?

  • The definition of an Indicator is: “A qualitative or quantitative reflection of a specific dimension of programme performance that is used to demonstrate performance / change”
  • It is distinguished from a Target which: “Specifies the milestones / benchmarks or extent to which the programme results must be achieved”
  • And it also different from a Measure which is: “The Tool / Protocol / Instrument / Gauge you use to assess performance”

Types of Indicators

  • The reason for using indicators is to feel the pulse of a project as it moves towards meeting its objectives or to see the extent to which it has been achieved. There are different types of indicators:
  • Risk/enabling indicators – external factors that contribute to a project’s success or failure. They include socio-economic and environmental factors, the operation and functioning of institutions, the legal system and socio-cultural practices.
  • Input indicators – also called ‘resource’ indicators, they relate to the resources devoted to a project or programme. Whilst they can flag potential challenges, they cannot, on their own determine whether a project will be a success or not.
  • Process indicators – also called ‘throughput’ or ‘activity’ indicators. They reflect delivery of resources devoted to a programme or project on an ongoing basis. They are the best indicators of implementation and are used for project monitoring.
  • Output indicators –indicates whether activities have taken place by considering the outputs from the activities.
  • Outcome indicators – indicates whether your activities delivered a positive outcome of some kind.
  • Impact indicators – Concerns the effectiveness, usually long term, of a programme or project as judged by the measurable achieved in improving the quality of life of beneficiaries or other similar impact level result.

Good Indicators

  • Good Performance Indicators should be
  • Direct (Does it measure Intended Result?)
  • Objective (Is it ambiguous?)
  • Adequate (Are you measuring enough?)
  • Quantitative (Numerical comparisons are less open to interpretation)
  • Disaggregated (Split up by gender, age, location etc.)
  • Practical (Can you measure it timeously and at reasonable cost?)
  • Reliable (How confidently can you make decisions about it?) (USAID, 1996)

SMART Indicators
Most people have also heard about SMART indicators:

  • Specific
  • Measurable
  • Action Oriented
  • Realistic
  • Timed

How we use indicators

  • For many of the evaluation initiatives that we help to plan M&E systems for, we usually work with the managers to set indicators that they understand and can use.
  • Although the issue of data availability and data quality is usually a big concern, it is often the indicators and targets that are set that could make or break an evaluation.

Case Study

  • Implementers of a teacher training initiative wants to know if their project is making a difference in the maths and science performance of learners.

Pitfalls

  • Alignment between Indicators & Targets (If the indicator says something about a number, then the target must also be couched in terms of a number, and not a percentage)
  • Averaging out things that do not belong together (i.e. maths and science) does not make sense at all.
  • Not disaggregating enough (Are you interested in all learners, or is it important to look at disaggregating your data by age group, gender, educator)
  • Assuming that all targets should be about an increase: (Sometimes a trend in the opposite direction exists and it is expected that your programme will only mediate the effects)
  • Assuming that an increase from 20% to 50% is the same as an average increase of 50% to 80%. (Psychometrists have used the standardised gain statistic for a very long time. It is interesting that we don’t see more of it in our programmes.)
  • Ignoring the statistics you will use in analysis: (In some cases you are using a sample and averages. This means an average increase might just look like an increase, but when you test for statistical significance it is actually not an increase)
  • Setting indicators that require two measurements where one would be enough (Are you interested in an average increase, or just the % of people that make some minimum standard.)
  • Ignoring other research done on the topic (If a small effect size is generally reported for interventions of these kinds, isn’t an increase of 30% over baseline a little ambitious?)
  • If you don’t have other research on the topic, it should be allowable to adjust the indicators.
  • Setting an indicator and target that assumes direct causality between the project activity and the anticipated outcome (Even if you have brilliant teachers, how must the learners perform if learners have nowhere to do homework, School discipline is non-existent and after learners have accumulated 10 years of conceptual deficits in their education?)
  • Ignoring Relevance, efficiency, sustainability, and equity considerations. (Is educators training really going to solve the most pressing need?If your programme makes a difference, is it at the same cost as training an astronaut?What will happen if the trained educator leaves?Does the educator training benefit rural learners in the same way in which it would benefit urban learners?)

Ways to address the pitfalls

  • Do a mock data exercise to see how your indicator and target could play out.
  • This will help you think through the data sources, the statistics, and the meaning of the indicator
  • Read extensively about similar projects to determine what the usual effect size is.
  • When you do your problem analysis, be sure to include other possible contributing factors, and don’t try to attribute change if it is not justifiable.
  • Look at examples of other indicators for similar programmes
  • Keep at it and work with someone who would be able to check your proposed indicators with a fresh eye.

Where to look
Example Indicators can be found in:

  • Project / Programme Evaluation reports from multi-lateral donor agencies
  • UNESCO Education For All Indicators
  • Long term donor-funded projects such as DDSP, QIP.
  • StatsSA publications and statistical extracts about the education sector.
  • Government M&E indicators.

Announcement from AEA about benefits

The AEA announced that two more Journals are available to members!

Announcement: American Evaluation Association Expands Online Journal Access

AEA Members now receive electronic access to two additional journals – Evaluation and the Health Professions and Evaluation Review – in addition to continued access to AEA’s own American Journal of Evaluation and New Directions for Evaluation, as part of membership benefits.

The journals’ content is searchable, and archived online content goes back multiple years.

Individual subscriptions to each journal are over $100 each, making AEA membership more of a value then ever at only $80. Members also receive AJE and NDE in hardcopy, discounts on conference and training registration, regular communications about news from all corners of the evaluation community, discounts on books, and the opportunity to participate in the life of the association and the field.

Learn more about AEA and join online at: www.eval.org

Centre for Global Development

This is the Centre for Global Development Report that upset so many people again. I mean really! Didn’t we agree that mixed methods are the way to go? RCTs Cannot possibly be the answer for all our impact evaluation questions.

From the CGD website at:

http://www.cgdev.org/content/publications/detail/7973


When Will We Ever Learn? Improving Lives Through Impact Evaluation

05/31/2006

Each year billions of dollars are spent on thousands of programs to improve health, education and other social sector outcomes in the developing world. But very few programs benefit from studies that could determine whether or not they actually made a difference. This absence of evidence is an urgent problem: it not only wastes money but denies poor people crucial support to improve their lives.

This report by the Evaluation Gap Working Group provides a strategic solution to this problem addressing this gap, and systematically building evidence about what works in social development, proving it is possible to improve the effectiveness of domestic spending and development assistance by bringing vital knowledge into the service of policymaking and program design.

In 2004 the Center for Global Development, with support from the Bill & Melinda Gates Foundation and The William and Flora Hewlett Foundation, convened the Evaluation Gap Working Group. The group was asked to investigate why rigorous impact evaluations of social development programs, whether financed directly by developing country governments or supported by international aid, are relatively rare. The Working Group was charged with developing proposals to stimulate more and better impact evaluations. This report, the final report of the working group, contains specific recommendations for addressing this urgent problem.

Monitoring without Indicators – Most Significant Change

On the Pelican list today, they sent through this handy reference to something that I think is infinitely useful for gathering proof and evidence when you don’t have indicators and stacks of pre-developed evaluation mechanisms.

Check it out at:
http://www.mande.co.uk/docs/MSCGuide.htm. and http://www.mande.co.uk/MSC.htm

The guide (Prepared by Rick Davies and Jess Dart) explains the MSC technique as follows:

“The most significant change (MSC) technique is a form of participatory monitoring and evaluation. It is participatory because many project stakeholders are involved both in deciding the sorts of change to be recorded and in analysing the data. It is a form of monitoring because it occurs throughout the program cycle and provides information to help people manage the program. It contributes to evaluation because it provides data on impact and outcomes that can be used to help assess the performance of the program as a whole.
Essentially, the process involves the collection of significant change (SC) stories emanating from the field level, and the systematic selection of the most significant of these stories by panels of designated stakeholders or staff. The designated staff and stakeholders are initially involved by ‘searching’ for project impact. Once changes have been captured, various people sit down together, read the stories aloud and have regular and often in-depth discussions about the value of these reported changes. When the technique is implemented successfully, whole teams of people begin to focus their attention on program impact.”

Certainly this looks like a very promising technique!

Report Back: Making Evaluation Our Own

A special stream was held on making Evaluation our own at the AfrEA conference. After the conference a small committee of African volunteers worked to capture some of the key points of the discussion. Thanks to Mine Pabari from Kenya for forwarding a copy!

What do you think of this?


Making Evaluation Our Own: Strengthening the Foundations for Africa-Rooted and Africa Led M&E

Overview & Recommendations to AfrEA

Niamey, 18th January, 2007

Discussion Overview

On 18 January 2007 a special stream was held to discuss the topic

Making Evaluation our own: Strengthening the Foundations for Africa-Rooted and Africa-Led M&E. It was designed to bring African and other international experiences in evaluation and in development evaluation to help stimulate debate on how M&E , which has generally been imposed from outside, can become Africa led and owned.

The introductory session aimed to set the scene for the discussion by considering i) What the African evaluation challenges are (Zenda Ofir) ii) The Trends Shaping M&E in the Developing World (Robert Piccioto) iii) The African Mosaic and Global Interactions: The Multiple Roles of and Approaches to Evaluation (Michael Patton & Donna Mertens). The last presentations explained, among others, the theoretical underpinnings of evaluation as it is practiced in the world today.

The next session briefly touched on some of the current evaluation methodologies used internationally in order to highlight the variety of methods that exist. It also stimulated debate over the controversial initiative on impact evaluation launched by the Center for Global Development in Washington. The discussion then moved to consider some of the international approaches that are currently useful or likely to become prominent in finding evidence about development in Africa (Jim Rugh, Bill Savedoff, Rob van den Berg, Fred Carden, Nancy MacPherson & Ross Conner)

The final session aimed to consider some possibilities for developing an evaluation culture rooted in Africa. (Bagele Chilisa). In this session some examples of how the African culture leans itself towards evaluation was given and also some examples that demonstrated that the currently used evaluation methodologies could be enriched if it considered an African world view.

Key issues emerging from the presentations and discussion formed the basis for the motions presented below:

  • Currently much of the evaluation practice in Africa is based on external values and contexts, is donor driven and the accountability mechanisms tend to be directed towards recipients of aid rather than both recipients and the providers of aim
  • For evaluation to have a greater contribution to development in Africa it needs to address challenges including those related to country ownership; the macro-micro disconnect; attribution; ethics and values; and power-relations.
  • A variety of methods and approaches are available and valuable to contributing to frame our questions and methods of collecting evidence. However, we first need to reexamine our own preconceived assumptions; underpinning values, paradigms (e.g. transformative v/s pragmatic); what is acknowledged as being evidence; and by whom before we can select any particular methodology/approach.

The lively discussion that ensued led towards the appointment of a small group of African evaluators to note down suggested actions that AfrEA could spearhead in order to fill the gap related to Africa-Rooted and Africa-Led M&E.

The stream acknowledges and extends its gratitude to the presenters for contributing their time to share their experiences and wealth of knowledge. Also, many thanks to NORAD for its contribution to the stream; and the generous offer to support an evaluation that may be used as a test case for an African-rooted approach – an important opportunity to contribute to evaluation in Africa.

In particular, the stream also extends much gratitude to Zenda Ofir and Dr. Sully Gariba for their enormous effort and dedication to ensure that AfrEA had the opportunity to discuss this important topic with the support of highly skilled and knowledgeable evaluation professionals.


Motions

In order for evaluation to contribute more meaningfully to development in Africa, there is a need to re-examine the paradigms that guide evaluation practice on the continent. Africa rooted and Africa led M&E requires ensuring that African values and ways of constructing knowledge are considered as valid. This, in turn, implies that:

§ African evaluation standards and practices should be based on African values & world views

§ The existing body of knowledge on African values & worldviews should be central to guiding and shaping evaluation in Africa

§ There is a need to foster and develop the intellectual leadership and capacity within Africa and ensure that it plays a greater role in guiding and developing evaluation theories and practices.

We therefore recommend the following for consideration by AfrEA:

o AfrEA guides and supports the development of African guidelines to operationalize the African evaluation standards and; in doing so, ensure that both the standards and operational guidelines are based on the existing body of knowledge on African values & worldviews

o AfrEA works with its networks to support and develop institutions, such as Universities, to enable them to establish evaluation as a profession and meta discipline within Africa

o AfrEA identifies mechanisms in which African evaluation practitioners can be mentored and supported by experienced African evaluation professionals

o AfrEA engages with funding agencies to explore opportunities for developing and adopting evaluation methodologies and practices that are based on African values and worldviews and advocate for their inclusion in future evaluations

o AfrEA encourages and supports knowledge generated from evaluation practice within Africa to be published and profiled in scholarly publications. This may include;

§ Supporting the inclusion of peer reviewed publications on African evaluation in international journals on evaluation (for example, the publication of a special issue on African evaluation)

§ The development of scholarly publications specifically related to evaluation theories and practices in Africa (e.g. a journal of the AfrEA)

Contributors

§ Benita van Wyk – South Africa

§ Bagele Chlisa – Botswana

§ Abigail Abandoh-Sam – Ghana

§ Albert Eneas Gakusi – AfDB

§ Ngegne Mbao – Senegal

§ Mine Pabari – Kenya

More Evaluation Checklists

Last week I put a reference to the UFE Check-list on my blog, and today I received a very useful link with all kinds of other evaluation check-lists on the AfrEA listserv . Try it out at:

http://www.wmich.edu/evalctr/checklists/checklistmenu.htm

It has Check-lists for

*Evaluation Management

*Evaluation Models

*Evaluation Values & Criteria

* Check-lists are useful for practitioners because it helps you to develop and test your methodology with view of improving it for the future.
* They are useful for those who commission evaluations because it reminds you what should be taken into account at all stages of the evaluation process.
* I think, however, that check-lists like these can be particularly powerful if they become institutionalised in practice – If an organisation requires the check-list to be considered as part of a day-to-day business process.

Making Evaluation our Own

At the AfrEA conference, there was a special stream on: ‘Making Evaluation our Own’. It aimed to investigate where we are in terms of having Africa rooted, Africa lead evaluations.

I found it particularly useful because it became patently obvious that there are African world views and African methods of knowing that are not yet exploited for Evaluation in Africa. This of course brings the whole debate about “African” Evaluation theories to bear, and asks which kinds of evaluation theories are currently influencing our practice as evaluators in Africa.

Marvin C. Alkin and Christina A. Christie developed what they call the EVALUATION THEORY TREE. It splits the prominent (North-American) evaluation theorists into three big branches: Theories that focus on the use of evaluation, theories that focus on the methods of evaluation and theories that focus on how we value when evaluating. You can find more information about this at http://www.sagepub.com/upm-data/5074_Alkin_Chapter_2.pdf

The second tree is a slightly updated version. It was interesting to note that most of my reading about evaluation has been on “Methods” and “Use”.

I think that if we are serious about developing our own African evaluation theories, we might need to develop our own African tree. Bob Piccioto mentioned that the African tree might use the branches of the above tree as roots, and grow its own unique branches.

A small commission from the conference put together a call for Action that outlines some key steps that should be taken if we hope to make progress soon. Hopefully I can post this at a later stage.

Keep well!

UFE & The difference between Evaluation and Research

At the recent AFREA conference I was again reminded of what we are supposed to be doing in evaluation. Consider the word evaluation: It is about valuing something. Valuing for the purposes of accountability and for learning and improvement.

It is not just research, and although some people have indicated that they get irritated with our attempts at distinguishing evaluation from research, I think it is critically important to distinguish between research and evaluation.

Depending on which paradigm you come from, one might argue that research can be the same as evaluation. I don’t argue with that. What I do have a problem with is people approaching evaluations like research projects where the focus is all on “How do we collect evidence?” The methodology is critically important, agreed, and there is nothing that grates me more than seeing how people use poorly designed evaluation methodologies to collect “evidence”.

But evaluation is not just about how we collect information. Evaluation is supposed to take it a step further and make some evaluative judgments based on the data that was collected. Just describing your evaluation findings without saying what it means is senseless.

It is good and well if you find information about the level of maths capacity in rural schools interesting, but an evaluation will also go further and indicate whether the project is relevant, effective, efficient, has an impact and is sustainable or creates sustainable results. Without this additional “Valuing” judgments, an evaluation is only a research project that may increase our knowledge, but don’t help us to make decisions.

Something that may help more evaluations to be true evaluations is the Utilization Focused Evaluation approach of Michael Quinn Patton. It is all about how to ensure that an evaluation serves its intended purpose for the intended users. Go ahead – google Utilization Focused Evaluation and see how many hits come up. It literally is the biggest thing that has hit the Evaluation community in the past 30 years, yet many people are blissfully ignorant of this.

For those who commission evaluations, Patton specifically created a checklist that may be of value in making sure that evaluations are useful. www.wmich.edu/evalctr/checklists/ufe.pdf It might need to be adapted for use in your specific setting, but it definitely asks a couple of pretty critical questions about our evaluations.

Go ahead… I dare you to read up more about UFE (Utilization Focused Evaluation) and not be excited about the possibilities that evaluation has!

Have A good day!

PS. I hope to post some more of my thoughts on the AfrEA conference over the next month or so!

IOCE

The IOCE is an international organisation for cooperation in evaluation and they have a couple of neat resources on their website:

http://www.ioce.net/resources/reports.shtml

The World Bank’s Independent Evaluation Group Finds Progress On Growth, But Stronger Actions Needed For Sustainable Poverty Reduction
The World Bank Independent Evaluation Group’s Annual Review of Development Effectiveness…


The World Bank’s Independent Evaluation Group (IEG) is releasing its 2006 Annual Report on Operations Evaluation (AROE)
The report assesses the progress, status, and prospects for monitoring and evaluating…


Joint UNICEF/IPEN Evaluation Working Paper on “New trends in development evaluation”


Resources for Evaluation and Social Research Methods
Links to on line books, manuals and guides and more…


What Constitutes Credible Evidence in Evaluation and Applied Research?
Highlights from the 2006 Claremont Symposium
>>

When Will We Ever Learn: Recommendations to Improve Social Development through Enhanced Impact Evaluation

Very very usable Evaluation Journal – AJE

I’ve just paged through the December 2006 issue of the American Journal of Evaluation, and once again I am impressed.

It is such a usable journal for practitioners like myself, whilst still balancing it with the academic requirements that a journal should have. They do this by including

  • Articles – That deal with topics applicable to the broad field of program evaluation
  • Forum Pieces – A section were people get to present opinions and professional judgments relating to the philosophical, ethical and practical dilemmas of our profession.
  • Exemplars – Interviews with practitioners whose work can demonstrate in a specific evaluation study, the application of different models, theories and priciples described in evaluation literature.
  • Historical Record – Important turning points within the profession is analyzed, or historically significant evaluation works are discussed.
  • Method Notes – Which includes shorter papers describing methods and techniques that can improve evaluation practice.
  • Book Reviews – Recent books applicable to the broad field of program evaluation are reviewed.

I receive this journal as part of my membership to the American Evaluation Association – at a fraction of the costs that buying the publication on its own would have.


Go ahead – try it out – Here is a link to its archive:

http://aje.sagepub.com/archive/

Log Frame Training – Common Challenges

I recently again facilitated a logframe workshop where I oriented the managers of intervention programmes towards basic log frame concepts and the idea of indicators, targets and means of verification.

Most people seem to intuitively grasp what we are trying to achieve when we present the workshop, and most take well to the assumption that it allows for better planning, monitoring and evaluation, but a set of common challenges seem to arise. In this entry I highlight three of these challenges and give an idea of how I try to get around them. I would be interested to hear from anyone how they approach these.

CHALLENGE 1:
Participants find it difficult to distinguish outputs, outcomes and impacts from one another. Even if we give them plenty of examples, clear definitions and an opportunity to practice their identification of the different kinds of results, they still find it difficult to correctly place these in the results chain. It is not absolutely crucial that they are placed correctly, but it definitely helps when you are later developing and indicators matrix. To help participants, I often give the following explanation

  • Outputs are what your programme delivers and are often a tangible indication that some activity was completed.
  • Outcomes are the changes you hope to see in the behaviour / skill / knowledge / values / attitudes of those you interact with in the shorter term.
  • Impacts are the other organisational and longer term changes you hope to see as a result of changed behaviour / skills / knowledge / values / attitudes of the participants.

And then I demonstrate it with a tomato plant example:

  • Planting tomato seeds, fertilising them and watering the soil are likely to result in a number of green sprouts emerging as a direct result of your “intervention”. These aren’t yet the tomatoes, but they tell you that you that some activity was completed and that you are possibly on your way to some sort of meaningful result (Output).
  • Having big fat red juicy tomatoes harvested tells you that you have achieved something – the seeds changed into something more useful (Outcome).
  • If you are able to eat your tomatoes and enhance your nutrition or if you sell the tomatoes to supplement your income, these are impact level results (Impact).

CHALLENGE 2:

When participants do a problem analysis they tend to accurately identify the level of intervention required to actually solve a problem. But when it comes to planning the intervention, they loose sight of the magnitude of the problem (despite being encouraged to go back to the problem analysis) and rather focus on the practicalities as it relates to their current organisational strength. So they agree to do two three hour workshops per term because that is all that they can manage. I often have to point them to the example again to get them to understand the effect of this kind of programming:

In the tomato plant example this equates to agreeing to water the tomatoes only once a month because that is all you have the time and staff for. And it obviously could lead to a reduction in the benefits gained.

CHALLENGE 3:

When developing a Log Frame Indicators Matrix, people have great difficulty in ensuring that the indicator , target and means of verification align well.

  • They might talk about the number of something in the indicator and put a percentage in the target. E.g. Indicator: The number of indicators that complete the course. Target: 90% of all Educators
  • They might talk about an increase in performance when they phrase the indicators, but only refer to a single measurement opportunity in the means of verification without any baseline data available. E.g. Indicator: Increase in learner performance on literacy test. Target: 80% of learners must pass. Means of Verification: End of year test

I have used the the following “recipe” with some success.

Appropriate targets if your indicator says something about an
INCREASE / IMPROVEMENT IN
–Number of people with skill / knowledge / appropriate behaviour
*e.g. 20% more people ….
–The knowledge / skill / quality level at which your participants can do something
*e.g. Average knowledge score increases with x%
– The number of people achieving a certain standard increases (e.x. pass, expemption)

* e.g. Number of persons passing increases with 20% over baseline

NOTE If you speak about an increase / improvement in your indicator / target your means of verification presupposes that knowledge about the baseline conditions and at least one other period in time will be required.

Appropriate targets if your indicator says something about achieving a
MINIMUM STANDARD
–Number of people achieving the minimum standard

*e.g. 80% of people must at least pass / get 80%
NOTE: This could be measured at a single instance only

Appropriate targets if your indicator says something about establishing SOMETHING NEW

–Number of people doing / showing something new

* e.g. 125 people must submit a business plan to COMSA
–The frequency with which people do something new

*e.g. Teachers to include open-ended questioning at least once in all observed lessons

Note: This could be measured at a single instance only.

My Impressions: UKES / EES Conference 2006

The first joint UKES (United Kingdom Evaluation Society) and EES (European Evaluation Society) evaluation conference was held at the beginning of October in London. It was attended by approximately 550 participants from over 50 countries – Also a number of the prominent thinkers in M&E from North America. Approximately 15 South Africans attended the conference and approximately 300 papers were presented in the 6 streams of the conference. The official conference website is at: http://www.profbriefings.co.uk/EISCC2006/

Although it is impossible to summarise even a representative selection of what was said at the conference, I was struck by particularly discussions around the following:

How North-South and West-East evaluation relationships can be improved.
A panel discussion was held on this topic where a representative from the UKES, IOCE (International Organisation for Cooperation in Evaluation), and IDEAS (International Development Evaluation Association) gave some input followed by a vigorous discussion about what should be done to improve relationships. The international organizations used this as an opportunity to find out what could be done in terms of capacity building, advocacy, sharing of experiences and representation in major evaluation dialogues (e.g. the Paris declaration on Aid effectiveness[1]) etc. Like the South African Association, these associations also run on the resources made available by volunteers so the scope of activities that can be started is limited. The need for finding high-yield, quick gains was explored.
Filling the empty chairs around the evaluation table
Elliott Stern (Past president of UKES / EES and Editor of “Evaluation”) made the point that many of the evaluations done are not done by people that typically identify with the identity of an evaluator – Think specifically of Economists. Not having them represented when we talk about evaluation and how it should be improved means that they miss out on the current dialogue, and we don’t get an opportunity to learn from their perspectives.

Importance of developing a programme theory regarding evaluations
When we evaluate programmes and policies we recognize that clarifying the programme theory can help to clarify what exactly we expect to happen. One of the biggest challenges in the evaluation field is making sure that evaluations are used in the decision-making processes. Developing a programme theory regarding evaluations can help us to clarify what the actions are that’s required to ensure that change happens after the evaluation is completed. When we think of evaluation in this way, it is emphasized once again that delivering and presenting a report only cannot reasonably be expected to impact the way in which a programme is implemented. More research is required to establish exactly under which conditions a set of specific activities will lead to evaluation use.

Research about Evaluation is required so that we can have better theories on Evaluation
Steward Donaldson & Christina Christie (Claremont Graduate University) and a couple of other speakers were quite adamant that if “Evaluation” wants to be taken seriously as a field, we need more research to develop theories that go beyond only telling us how to do evaluations. Internationally evaluation is being recognized as a Meta-Discipline and a Profession, but as a field of science we really don’t have a lot of research about evaluation. Our theories are more likely to tell us how to do evaluations and what tool sets to use, but we have very little objective evidence that one way of doing evaluations is better or produce better results than another.

Theory of Evaluation might develop in some interesting ways
There was also talk about some likely future advances in evaluation theory. Melvin Mark (Current AEA President) said that looking for one comprehensive theory of evaluation is probably not going to deliver results. Different theories are useful under different circumstance. What we should aim for are more contingency theories that tell us when to do what. Current examples of contingency theories include Patton’s Utilization Focused Evaluation Approach – The intended use by intended users determines what kind of evaluation will be done. Theories that take into account the phase of implementation is also critically important. More theories on specific content areas are likely to be very useful e.g. evaluation influence, stakeholder engagement etc. Bill Trochim (President-Elect of AEA) presented a paper on Evolutionary Evaluation that was quite thought provoking and continued from thinking of Donald Campbell etc.

Evaluation for Accountability
Baronness Onora O’Neill (President of the British Academy) expanded what accountability through evaluation means by expanding on the question “Who should be held accountable and by whom?” She indicated that evaluation is but one of a range of activities that’s required to keep governments and their agencies accountable, yet a very critical one. The issue of evaluation for accountability was also echoed by other speakers like Sulley Gariba (From Ghana, previous president of IDEAS) with vivid descriptions of how the African Peer Review Mechanism could be seen as one such type of evaluation that delivers results when communicated to the critical audience.

Evidence Based Policy Making / Programming
Since the European Commission an the OECD was well represented, many of the presentations focused on / touched on topics relating to evidence based policy making. The DAC principles of Evaluation for development assistance (namely Relevance, Effectiveness, Efficiency, Impact, Sustainability) seems to be quite entrenched in evaluation systems, but innovative and useful ways of measuring impact level results was explored by quite some speakers.

Interesting Resources
Some interesting resources that I learned of during the conference include:
www.evalsed.com An online resource of the European Union for the evaluation of Socio-economic development.
The SAGE Handbook of Evaluation Edited by Ian Shaw, Jennifer Green, and Melvin Mark. More information at: http://www.sagepub.com/booksProdDesc.nav?prodId=Book217583
Encyclopedia for Evaluation edited by Sandra Mathisson. More info at: http://www.sagepub.com/booksProdDesc.nav?prodId=Book220777 Other Guidelines for good practice: http://www.evaluation.org.uk/Pub_library/Good_Practice.htm
[1] For more info about the Paris Declaration look at http://www.oecd.org/document/18/0,2340,en_2649_3236398_35401554_1_1_1_1,00.html

Social Entrepreneurship

I’ve got a bee in my bonnet. And I must admit, I don’t quite know what to do with it. It probably has something to do with all of those systems-theory lectures I had at university. Here it is: We know the world and what happens in it cannot necessarily be explained in a linear fashion. So why, oh why do we plan and evaluate ALL our projects according to the logic model (where the combination of A, B and C under conditions D and E will produce F, G and H)? – then again… maybe it is just me and other people (Maybe I should Ask Bob Williams… he’s a real systems guy!) already have very nicely functioning alternative toolsets and methods to evaluate the non-linear world. (If you happen to be one of them, please come and save me from my ignorance and leave a comment so that I can learn from you)

I’m not proposing that we throw out that approach totally. But really! Given the scope of the developmental challenges we have here in SA, we must really hope for a miracle if we think that our logically planned out projects are going to solve all of our problems. If we have a little faith in the fact that we live in a chaotic system that has the capacity for self-organisation, we might actually want to start planning our interventions in a way that empowers key agents in the system to go out and do a number of unexpected and hopefully amazing things.

A related question: Why do we ONLY fund and evaluate projects and organizations, when it is people that make the difference? Let me clarify, I’m not saying projects and organizations don’t make a difference… But it is the 79 year old lady that decides to do something for the kids of her community on one special day. It is the social worker who thinks of a way to take the extra food off our tables and find a way to distribute it to those who need it… It is the guy who drives past the men on the side of the road that suddenly thinks of a way to provide tools and job opportunities to them.

These special people – “Social Entrepreneurs” I think they are called – Should be funded to do what they do best – think of ideas, implement them and set up structures. Because lo and behold they start worrying about how to put dinner on the table and abandon their potentially brilliant idea to take a desk job somewhere! This is apparently exactly what Ashoka does. See their website for more information: http://www.ashoka.org/africa

When venture capital investors want to invest in a new and innovative idea the majority of their pre-assessment work is around the individual that is pitching the idea. Some people just have the diversity of networks, skills and resources at their disposal to make things happen. Maybe there is some lesson in this for us!

Common Pitfalls in M&E

This is an outline for a presentation I recently deliverd.

Common Pitfalls in Monitoring and Evaluation
Issues to Consider when you are the implementer / commissioner of evaluations

Introduction: What people Think of Evaluations
Often people are very scared of evaluations because of previous experiences, lack of experience or a general misconception regarding evaluations.

Introduction: Why must we measure?
Although there is growing consensus that we need to measure the results (outputs, outcomes and impacts) of our projects / programmes / policies, there is still much confusion about exactly why we are doing it.
Two main purposes of evaluations:
— Accountability to various stakeholders
–Learning to improve the projects / programmes / policies
The projects / progammes / policies we implement affect thousands of people and if we get it wrong thousands will be affected negatively (or not affected at all)
We often complain about the cost of measuring our impact, but have we considered the costs of not measuring our impact?

Introduction: We want to evaluate BUT…
Once we are convinced that we should be measuring our impacts, a range of other questions come up:
–How should it be evaluated?
–When should it be evaluated?
–How will we know that the impact is the best possible?
–How do we know if it is our programme that made those differences?
–Can we do our own evaluation or should we get some specialist to do it?
–If there were simple one-size fits all answers to these questions, evaluation would probably have been much more appealing than it is today.

Common Pitfalls in Evaluation 1
Failing to clarify the intended use or the intended users of the evaluation – Producing “Door Stops”.
Thinking you can evaluate your impact after year one of an intervention in a complex system – Expecting too much.
Thinking your impact evaluation is only something you need to worry about at the end of the project – Waiting too long.
Measuring every detail of a programme thinking that it will allow you to get to the big picture “impact” – Measuring too much.
Doing the wrong type of evaluation for the phase in which the project is in – Method / timing match.

Common Pitfalls in Evaluation 2
Allocating too little time and resources to the evaluation – More is better.
Allocating too much time and resources to the evaluation – Less is more.
Sticking to your or someone else’s “template” only – One size does not fit all.
Thinking that an online M&E system will solve all of your problems – Computers don’t solve everything.
Not planning for how the evaluation findings will be used – Findings don’t speak for themselves.

Common Pitfalls in Evaluation 3
Running a lottery when you are supposed to receive tenders for doing the evaluation – Lottery evaluations
Sending the evaluation team in to open Pandora’s box – Don’t do evaluation if you need Organisational Development.
Doing an impact evaluation without taking into consideration the possible influence of other initiatives / factors in the environment – Attribution Error.
Doing an impact evaluation without looking what the unintended consequences of the project was – Tunnel Vision
Ignoring the voices of the “evaluated” – Disempowering people

Common Pitfalls in Evaluation 4
Expecting your content specialist to also be an evaluation specialist and vice-versa – Pseudo Specialists lead to pseudo knowledge
Doing evaluations, creating expectations and then ignoring the results
Do not report statistics like level of significance and effect size when you incorporate a quantitative aspect to your evaluation – Being afraid of the “hard stuff”
Do not acknowledge the lenses you are using to analyse your qualitative data – Being colour blind
Getting hung up on the debate about whether quantitative / qualitative methods are better – Method Madness

How to address the pitfalls
Given that until very recently there were no academic programmes focusing on training people in evaluation, it is important that we find ways of improving our understanding of the field.
You need not be an evaluation specialist to be involved with evaluation.
Make sure that the evaluators you work with have development as an ultimate goal.

How to address the pitfalls
Resources for helping you to do / commission better evaluations
Join an association: For example the South African Monitoring and Evaluation Association (http://www.samea.org.za/) or the African Evaluation Association (http://www.afrea.org/)
Take cognisance of the guidelines and standards produced by these organisations
Make use of the many online resources available on the topic of evaluation (Check out Resources on the SAMEA web page)

When it really doesn’t make sense to use euphemisms

The following call for submissions was recently circulated in the M&E community.

“ORGANISATION ABC wants to engage in contracts with representative independent individual contactors in all provinces. We are therefore inviting representative individuals who are well qualified and experienced in Monitoring and Evaluation and related areas to submit their curriculum vitae’s and relevant information for consideration and possible invitation to attend a selection interview and deliver a simulated presentation.”

What is all of this talk about “representative individuals” about? I wonder why they just couldn’t come out and say “Individuals from Historically Disadvantaged Groups”. Strictly speaking, as a white female I am surely representative of some demographic in South Africa, ‘though I don’t think I am exactly what they mean under “representative individual!

And on an entirely non-M&E note, I read the following poem from Antjie Krog in “Verweerskrif” published by Umuzi in 2006 (Also available in English as “Body Bereft”. Seems like we won’t get away from representing something ‘till the day death comes knocking.

namens myself

namens niemand hoef ek iets meer te benader nie
namens niemand hoef ek meer verantwoording
te doen of om vergifnis te vra nie.

niemand se gemarginaliseerde perspektief
hoef ek meer op tafel te plaas
of my in ander se vel te verbeel nie

die eerste voorhoedes van die dood
het opgedaag en die liggaam gly soos sand
deur die vingers. apatie neutraliseer die sintuie

oorlewing ontplooi soos ‘n woestaard en sny
jou af van ander sodat jy al meer vertroud
raak met die na-binne-gedraaidheid van die dood

Laai vir laai word jy leeggemaak
Tot net nog die leë binnekant jou raak

Why do we Use Logic Models?

We often use logic models when we do evaluations, and I must admit, I don’t often wonder why I do it. The value is just implicit to me. On the AEA listserv, Sharon Stout put a summary together of what logic models are good for, and I agree with all of this. She writes:

“Below is my synopsis of Jonathan Morell’s synopsis (plus later additions by Patricia Rogers) with additional text taken from a post of Doug Fraser’s thrown in with a short bit credited earlier to Joseph Wholey.
See below …

The logic model serves four key purposes:

— Exploring what is valued (values clarification) – e.g., as in building consensus in developing a logic model, how elements interact in theory, and how this program compares;

— Providing a conceptual tool to aid in designing an evaluation, research project, or experiment to use in supporting — to the extent possible – or falsifying a hypothesized causal chain;

— Describing what is, making gaps between what was supposed to happen and what actually happened more obvious, and more likely to be observed, measured, or investigated in future research or programming; and

— Finally, developing a logic model may make evaluation unnecessary, as sometimes the logic model shows that the program is so ill-conceived that more work needs to be done before the program can be implemented – or if implemented, before the program is evaluated.”


Michael Scriven then took the discussion further, and again I absolutely agree with everything he says:

“Good job collecting the arguments for logic models together. Of course, they do look pretty pathetic when stripped down a bit–to the sceptical eye, at least. It might not be a bad idea to gather some alternative views of ways to achieve the claimed payoffs, if you’re after an overview. Here’s a overcompressed effort:

“Key purposes of logic models,” as you’ve extracted them from the extended discussion:
1. Values clarification. Alternative approach: identify assumed or quoted values, and clarify them as values, mainly by identifying the standards on their dimensions that you will need in order to generate evaluative conclusions; a considerably more direct procedure.

2. An aid in designing the evaluation. Alternative approach: Do it as you would do it for a black box, since you need to have that skill anyway, and it’s simpler and less likely to get you offtrack (i.e., look for how the impact and process of the program score on the scales you have worked up for needs and other values)

3. Describing what ‘is’. The program theory isn’t part of what is, so do the program description directly and avoid getting emroiled in theory fights.

4. Possibly avoid doing the evaluation. None of your business whether they’re great thinkers; they have a pgrm, they want it evaluated, OK do your job.

Then there’s other relevant considerations like:

5. Reasons for NOT working out the logic model.
Reason A: you don’t need it, see 1 above.
Reason B: your job is evaluating not explaining, so you shouldn’t be doing it.
Reason C: doing it takes a lot of time and money in many cases, so it often cuts down on the time on doing the real evaluation, so if you budgeted that time, you’ll get underbid, and if you didn’t, you’ll go broke.
Reason D: in many cases, the logic model doesn’t make sense but the program works, so what’s the payoff from finding that the model is no good or improving–payofff meaning payoff for the application field that wants something that works and doesn’t care whether it’s based on the power of prayer, the invocation of demons, good science, or simple witchcraft.(NOW THIS HAD ME IN STITCHES!) Think about helping the people first, adding to science later, on a different contract.

In general, the obsession with logic models is running a serious risk of bringing bad reputations to evaluators, and to evaluation, since evaluators are not expert program designers and not the top experts in the subject matter field that are often the only ones that can produce better programs. You want to be a field guru, get a PhD and some other creds in the field and be a field guru; you want to find out if the field gurus can produce a program that works, be an evaluator. Just don’t get lost in the woods because you can’t get the two jobs distinguished (and try not to lure too many other innocents with you into the forest).

Olive branches:
(i) of course, the logic theory approach doesn’t always fail, it’s just (mostly) a way of wasting time that sometimes produces a good idea, like doodling or concept mapping (when used out of place);
(ii) of course, it makes sense to listen to the logic theory of the client, since that’s part of getting a grip on the context, and asking questions when you hear it may turn up some problems they should sort out. Fine, a bonus service from you. Just don’t take fixing the logic model as one of your duties. After all:
(iii) Some of the most valuable additions to science come about from practices like primitive herbal medicine (eg the use of quinine, aspirin, curare) or the power of faith (hypnosis, faith-healing) that work although there’s no good theory why they work; finding more of those is probably the best way that evaluators can contribute to science. If you require a good theory before you look at whether the program works, you’ll never find these gold mines. So, though it may sound preachy, I think your first duty is to evaluate the program, even if your scientific training or recreational interests incline you to try for explanations first.

My conclusion is that next time, before I go about writing up a logic model “just because it is the way we do evaluations” I’ll be a little bit more critical and consider whether this isn’t an instance where I should not have to get a logic model.

Cultural Competence of Evaluators

Hazel Symonette from the University of Wisconsin recently visited South Africa and presented M&E workshops in collaboration with the South African Monitoring and Evaluation Association. Unfortunately my diary did not allow me to attend any of the workshops, but I was lucky enough to have some interaction with her on an informal basis. This made me think about cultural competence required by evaluators. Look, we are long past the positivistic view where an evaluator was believed to be the expert able to look at behaviour and responses of people and categorise it objectively. What Hazel’s visit reinforced for me was the fact that cultural competence and identifying the lenses through which we look is extremely important if we want to do a good job as an evaluator.

This morning I read an article in the paper about learners in Mpumalanga schools:

‘Teachers are bewitching us’ 2006-08-16 19:07:56 http://www.mweb.co.za/news/?p=top_article&i=224129

There appears to be a growing tendency among Mpumalanga school pupils to accuse their teachers of witchcraft and then start a riot or boycott class. Nelspruit – There’s a growing tendency among Mpumalanga school pupils to accuse their teachers of witchcraft and then start a riot or boycott class. Pupils at four schools have rioted in separate incidents since March, said provincial education spokesperson Hlahla Ngwenya on Wednesday. The latest incident happened on Monday when pupils at Mambane secondary school in Nkomazi, south of Malelane, refused to attend classes after allegations that teachers were bewitching them. The pupils returned to class on Tuesday. “Our preliminary reports indicate that the pupils protested after some of their peers died in succession over a short period,” said Ngwenya. “They seem to believe this was the doing of their teachers.” He said the department was investigating the incident and that pupils found guilty of instigating the boycott faced expulsion.

Imagine I was an evaluator in that community, working with the schools on the evaluation of some whole school development initiative. From my Westernised perspective witchcraft is just silly, and people believing in witchcraft are obviously mistaking one issue for another. Do I have the competence to be the evaluator in such a situation? How valid would my conclusions have been if I was in that situation?

I would probably have searched for alternative explanations, or more culturally acceptable explanations – I.e. There is obviously a problem in the relationship between the educators and the learners. It also seems that there are a range of very unfortunate circumstances (possibly a problem with HIV/AIDS?) in that community that needs attention. Just because I don’t accept their explanation and choose to come up with other explanations that are more culturally acceptable in my frame of reference (and probably in the frame of reference from which the programme donors come), does that mean it is the correct answer? Isn’t there maybe something beyond my perspective?

In my time as an evaluator I have come across a couple of other similarly absurd sets of behaviours – Teachers that toyi-toyi about catering whilst being on a government sponsored training session. Project beneficiaries refusing to disclose their names during interviews about an NGO’s performance. Clients being scared of saying anything out of fear that they might experience negative circumstances. Maybe these “absurdities”, when I recognize them, is a cue that I am out of my league?

Public Sector Accountability and Performance Measurement

“I have been working now for about 20 years in the area of evaluation and performance measurement, and I am so discouraged about performance measurment and results reporting and its supposed impact on accountability that I am just about ready to throw in the towel. So I have had to go right back to the basics of reporting and democracy to try to trace a line from what was intended to what we have ended up with.” (Karen Hicks on 28 July 06 on the AEA Evaltalk listserv).

This made me think – In our government, at least in the departments I work with, this is also quite a prominent issue. We do so much reporting and performance measurement, but does it help us to be more accountable? Why do we do all of this reporting, and who do we do the reporting to?

A national departments’ strategic planning and performance reporting manual explains what the intention is with the government M&E:

“Every five years the citizens of South Africa vote in national and provincial elections in order to choose the political party they want to govern the country or the province for the next five years. In essence the voters give the winning political party a mandate to implement over the next five years the policies and plans it spelt out in its election manifesto.
Following such elections the majority party (or majority coalition) in the National Assembly elects a President, who then selects a new Cabinet. The President and the Cabinet have the responsibility (mandate) of implementing the majority party’s election manifesto nationally. While at the provincial sphere, the majority party (or majority coalition) in each provincial legislature elects a Premier, who selects a new Executive Committee. The Premier and the Executive Committee have the responsibility (mandate) of implementing the majority party’s election manifesto within the province”.

The governing party’s election manifesto gets translated into policy and plans, and particularly the strategic plans and annual performance plans are key in this regard. The strategic plans spell out, for a five year period, what the department’s goals, objectives and priorities will be. Since there has been quite an infusion of the idea that “what gets measured, gets managed” in South African Government, Government Departments are also encouraged to set Mesurable Objectives and Performance Indicators relating to all of the goals and objectives in the strategic plan. These Measurable Objectives and Indicators are then used to reflect on an annual basis on the performance of a Department.

A common problem with this approach is that Departments want to set indicators that measure the outcome of all the Departments’ activities at activity level, rather than at programme level. This leads to the unfortunate result of a million and ten indicators that are too unwieldy to communicate and analyse effectively. Other common problems also include misalignment between the indicators and the objective it is supposed to measure, and some objectives just do not have any measurable objectives because the data that is available does not allow for efective measurement.

Besides all of these difficulties, though, the biggest drawback of this type of reporting for accountability is that it comes down to government reflecting on its own performance against governments’ plans. For the sake of democracy it is important that reporting should go beyond this and place information in the hands of the public that would allow them to not only critically reflect on government’s success in implementing its plans, but also critically reflect on the appropriateness of the plans and the prioritisation of objectives in the first place.

South Africa has come up with some sort of solution to this challenge by instituting the Public Services Commission with the mandate to evaluate the public service on an annual basis against nine constitutionally enshrined principles. The result of this evaluation is the PSC report entitled: State of the Public Service Report which is published annually. The 2006 report is available at:
http://www.psc.gov.za/docs/reports/2006/designed%20report%20220506.pdf

Google Scholar

This is such a good idea, I wonder why they didn’t come up with it a long time ago.
Google has a new search engine for searching academic literature online.
www.scholar.google.com

Doing a search for “Well Being” on Google Scholar, returned 61,600 results. The top results returned include:

Psychological Well-Being in Adult Life.CD Ryff – Current Directions in Psychological Science, 1995 – Blackwell Synergy … Being (Aldine, Chicago, 1969); E. Diener, Subjective well-being, Psychological Bulletin,95, 542-575 (1984); MP Lawton, The varities of wellbeing, in Emotion … Cited by 81Web Search
[CITATION] Scales for the measurement of some work attitudes and aspects of psychological well-beingP Warr, J Cook, T Wall – Journal of Occupational Psychology, 1979
Cited by 235Web Search
[CITATION] Relation of agency and communion to well-being: Evidence and potential explanationsVS Helgeson – Psychological Bulletin, 1994
Cited by 116Web SearchBL Direct
[CITATION] The measurement of well-being and other aspects of mental healthP Warr – Journal of Occupational Psychology, 1990
Cited by 102Web Search
… patient centred care of diabetes in general practice: impact on current wellbeing and future disease …group of 6 »AL Kinmonth, A Woodcock, S Griffin, N Spiegal, MJ … – British Medical Journal – bmj.bmjjournals.com … General Practice. Randomised controlled trial of patient centred care of diabetesin general practice: impact on current wellbeing and future disease risk. … Cited by 117Web SearchBL Direct
Factors affecting the emotional wellbeing of the caregivers of dementia sufferersgroup of 3 »RG Morris – The British Journal of Psychiatry, 1988 – bjp.rcpsych.org … Royal College of Psychiatrists. Factors affecting the emotional wellbeing ofthe caregivers of dementia sufferers. RG Morris, LW Morris … Cited by 67Web Search
Sports participation and emotional wellbeing in adolescents.group of 2 »A Steptoe, N Butler – Lancet, 1996 – ncbi.nlm.nih.gov … Sports participation and emotional wellbeing in adolescents. Steptoe A,Butler N. Department of Psychology, St George’s Hospital … Cited by 55Web SearchBL

Doing the same search on the normal google delivers 23,000,000 hits with the following under the top ranked items:

Well Being
WellBeing of Women is the only national charity funding vital research into all aspects of women’s reproductive health.www.wellbeingofwomen.org.uk/ – 18k –
CachedSimilar pages
WellBeing
WellBeing.com.au Australia – natural health directory, courses and seminars, natural health articles and more. Yoga, Acupuncture, Bowen Therapy, …www.wellbeing.com.au/ – 43k –
CachedSimilar pages
A manifesto for wellbeing
We often think of wellbeing as happiness, but it is more than that. … But for most Australians more money would add little to their wellbeing. …www.wellbeingmanifesto.net/ – 20k –
CachedSimilar pages
Mental Health and Wellbeing
Information on Australian Government mental health and wellbeing and suicide prevention initiatives, including beyondblue – the National Depression …health.gov.au/internet/wcms/publishing.nsf/Content/Mental+Health+and+Wellbeing-1 – 17k –
CachedSimilar pages
Well Being Journal
Well Being Journal: a health and wellness journal covering alternative medicine, natural healing, nutrition, herbs, and spiritual medicine.www.wellbeingjournal.com/ – 9k –
CachedSimilar pages
Australian Centre on Quality of Life – The Australian Unity Index …
The AustralianUnity Wellbeing Index is designed to fill this niche. … “The Wellbeing of Australians – Impact of the Impending Iraq War” …acqol.deakin.edu.au/index_wellbeing/index.htm – 17k –
CachedSimilar pages

Nice, very nice!

Maths and Science Education Initiatives

  • Maths and Science education initiatives are very necessary in the South African context. But it is also important to ensure that they deliver the goods at the end of the day. Different approaches have been tried to assist with the state of South African learners’ maths and science skills. The type of initiatives that we came across in our previous evaluations included:
    *Maths and Science Saturday schools that aimed to compensate for poor classroom based teaching and learning and giving the learners another shot at achieving the maths and science outcomes at preprimary and secondary phase.
    *Maths and Science Saturday or Holiday schools that aimed to prepare learners adequately for the Senior Certificate Examination
    *Upgrading of teacher qualifications through giving maths and science teachers the opportunity to gain full tertiary qualifications in maths or science
    *Afternoon workshops where skilled maths or science teachers did demonstration lessons with other maths and science educators to convey some lesson presentation ideas.
    *Building and equipping science labs to give learners the opportunity to engage fully with the Maths and science curriculum.
    *Commercially run science and maths exhibit centres that host interactive displays to demonstrate mathematical / scientific principles.
    *Science and maths fares, expos and exhibits.
    *Intensive Post matric course / bridging courses that focus heavily on science and maths tuition in order to help learners gain access to tertiary courses such as engineering.
    *Computer based science and maths learning using age appropriate software in computer laboratories.

    The lessons learnt were multiple and ad hoc, some of which I have taken the time to summarise below:
    · Once off workshops cannot do much to solve pervasive problems. Workshops should happen regularly and make space for the beneficiary teachers or learners to input into the content of the workshops.
    · Workshops where participants are not required to do anything more than attend, are unlikely to motivate beneficiaries to really participate and learn.
    · If the learning material is made available for further use in the classroom or with other colleagues at the school, it is likely to have an impact beyond the one learning encounter
    · Providing a solution (e.g. computer lab or teacher training programme) without the necessary support and maintenance will quickly negate the initial investment and reduce the impact
    · A multidimensional approach combining different strategies are imperative for success
    · Good programme management capacity is imperative, and should also include a mechanism to control for quality of content.
    · Programmes that collect basic monitoring data (number of beneficiaries, number of activities offered, cost per beneficiary per day) were more likely to be well run, and were also more likely to be very cost efficient.
    · There is limited cooperation between different agencies approaching the same problem and over reliance on a specific methodology- Once an agency has a hammer that makes some hits, they tend to want to fix all problems with this tool.

    Some documents that I found useful include:

    * David H. Greenberg, Charles Michalopoulos, Philip K. Robins : A Meta-Analysis of Government Sponsored Training Programs. www.mdrc.org/publications/264/full.pdf
    * HSRC. Trends in International Maths and Science Study results for South Africa http://www.hsrc.ac.za/research/programmes/ESSD/timss2003/mediaRelease.pdf *Coalition for Evidence-Based Policy : How to Solicit Rigorous Evaluations of Mathematics and Science Partnerships (MSP) Projects – A User-Friendly Guide for MSP State Coordinators. Available online at: http://www.ed.gov/programs/mathsci/issuebrief.doc

* Coalition for Evidence-Based Policy : How to Conduct Rigorous Evaluations of Mathematics and Science Partnerships (MSP) Projects – A User-Friendly Guide for MSP Project Officials and Evaluators. Available online at: http://www.ed.gov/programs/mathsci/mspbrief2.doc

Cute Web Resource on Logic Models

We often have to do training on Logic models and assist our clients in developing indicator frameworks. There are various resources on the net available to help you do this, but in the end we usually have to facilitate a workshop with the clients.

Before I can send a consultant out to do some training for us, I have to make sure that they understand the concepts exactly as we do. I have found a cute resource that might show the way on how we can start to streamline our knowledge management processes. Instead of sitting with a consultant everytime before an assignment, we could start using technology to make the job easier. Videotaping a training session is one way of doing it, but at the following link you will find a particularly cute example of how one could use flash to create a website / CD. I think this is an excellent resource!

http://www.usablellc.net/Logic%20Model%20(Online)/Presentation_Files/index.html

Also, some discussion on the AEA list recently pointed to the following basic guides about evaluation.
http://gsociology.icaap.org/methods/basicguides.html

Logistic Regression & Odds Ratios

We seldom or ever get to use inferential statistics when we do M&E. I think that there might actually be room for including some of these statistics in our evaluations. Here is an example of how logistic regression was used to inform a VCT centre’s marketing campaign:

We used logistic regression to determine which sets of factors associate significantly with a person’s propensity to go for an HIV test. The survey covered various knowledge questions (e.g. can HIV be transfered via a toothbrush?), biographical information (how old are you, are you married?) and a variety of risk factors (did you use a condom last time you had intercourse, have you had more than one sexual partner over the past year). The intention was to find out who to market VCT services to. For example, if we found that men who had multiple partners and are younger than 25 and have at least matric are more likely to test than those who are older than 25 or do not have matric, then there is a whole marketing campaign right there!

The logistic regression yields an odds ratio and an adjusted mean.

An odds ratio indicates the likelihood that a specific indicator or scale is associated with a behaviour occurring or not occurring. If the odds ratio is larger than 1, then it indicates that it is likely that the indicator is associated with the occurrence of the outcome variable. If the odds ratio is smaller than 1, then it indicates that is likely that the indicator will be associated with the non-occurrence of the outcome variable.

For example, if we are checking whether having tested previously would co-occur with the intention to test in future, we may get the following results.
Unadjusted Means for
Intention to test
No Yes Odds Ratio
Person tested previously 0.28 0.58 3.51
Because the odds ratio is positive, we can conclude that people that tested previously are about 3 times more likely to intend to test in future. The unadjusted means confirm this: If a person is likely to test (he / she falls in the Yes category) he or she “scores” 0.58 out of 1 (Where 1 indicates that the person did test previously) while a person that is not likely to test (he / she falls in the No category) only “scores” 0.28 out of 1.

Notes to Self

As a member of the AEA, I subscribe to their EVALTalk listserv (Archives at http://bama.ua.edu/archives/evaltalk.html). These are some of the useful things they mentioned over the past week, that I should investigate a bit more because it might be of relevance to my work: *****************************************
*When you have quant data, you often use tables and graphs for representing your data.
*Apparently “The Visual Display of Quantitative Information” by Edward Tufte is a really good resource. It can be ordered for around $40 from the website: htttp://www.edwardtufte.com/tufte/

*”Visualizing Data” by William Cleveland is said to be another good source.
*And then there is: Trout in the Milk and Other Visual Adventures by Howard Wainer. Here is an indication of the type of things he has to say:
http://www-personal.engin.umich.edu/~jpboyd/sciviz_1_graphbadly.pdf

*****************************************
*Rasch Analysis might be useful to use when analyzing test scores.
From http://www.rasch-analysis.com/using-rasch-analysis.htm
a Rasch analysis should be undertaken by any researcher who wishes to use the total score on a test or questionnaire to summarize each person. There is an important contrast here between the Rasch model and Traditional or Classical Test Theory, which also uses the total score to characterize each person. In Traditional Test Theory the total score is simply asserted as the relevant statistic; in the Rasch model, it follows mathematically from the requirement of invariance of comparisons among persons and items.
A Rasch analysis provides evidence of anomalies with respect to
the operation of any particular item which may over or under discriminate
two or more groups in which any item might show differential item functioning (DIF) anomalies with respect to the ordering of the categories. If the anomalies do not threaten the validity of the Rasch model or the measurement of the construct, then people can be located on the same linear scale as the items the locations of the items on the continuum permits a better understanding of the variable at different parts of the scale locating persons on the same scale provides a better understanding of the performance of persons in relation to the items. The aim of a Rasch analysis is analogous to helping construct a ruler, but with the data of a test or questionnaire.

More info at:
http://www.rasch.org/rmt/rmt94k.htm
http://www.winsteps.com/
*****************************************
* When we compare pre- and post scores, we usually make the faulty assumption that the gain is measured on a unidimensional scale with equal intervals. In fact, you have to normalise your scores first. A gain from 45 to 50% (5 points) is not the same as a gain from 95 to 100% (also five points) The following formula can be used: g = [{%post} – {%pre}] / [100% – {%pre}]
Where:
The brackets {. . .} indicate individuals averages,
g is the actual(normalized)average gain

So if a person improved from 45% to 50% his gain would be:

{g} = (50 – 45)/ (100 – 45) = 5/55 = 0.091 (On a scale from 0 to 1).
This means the person learnt 9.1% of what he didn’t know on the pre-assessment by the time he was assessed again.

If a person improved from 95% to 100% his gain would be:

{g} = (100 – 95) / (100 – 95) = 5/5 = 1 (On a scale from 0 to 1). This means the person learnt 100% of what he didn’t know on the pre-assessment by the time he was assessed again. (The graph at the bottom demonstrates the logistic curve of this formula)

This formula should only be used if:
(a) the test is valid and consistently reliable;
(b) the correlation of {g} with {%pre} (for analysis of many courses), or of single student g with single student %pre (for analysis of a single course), is relatively low; and
(c) the test is such that its maximum score imposes a performance ceiling effect (PCE) rather than an instrumental ceiling effect (ICE).

The Gaps in Evaluation

Just last week I was lamenting the fact that we get so few opportunities to conduct proper impact evaluations in the work that we do. Especially if it comes to training initiatives.

If we use the language of the Kirkpatrick model (which has been criticised a lot, I know, but its useful for this discussion), we often end up doing evaluations at Level 1 (Reaction and Satisfaction of the training participants) Level 2 (Knowledge evaluation) and if we are really lucky Level 3 (behaviour change). Seldom, if ever, do we get an opportunity to assess the Level 4 results (organisational impact) of initiatives.

One of our clients are training maths teachers in a pilot project that they hope to roll out to more teachers. In this evaluation we have the opportunity to assess teachers’ opinions about the training (through focused interviews with selected teachers), their knowledge after the training (through the examinations and assignments they have to complete) as well as their implementation of the training in the class(through a classroom observation). We will even go as far as to try to get a sense of the organisational impact (by assessing learners). The design includes a control group and experimental group ala Cook and Campbell quasi experimental design guidelines. The problem, however, is that we had to cut the number of people involved in the control group evaluation activities and we had to make use of the staff from the implementing agencies to collect some data. Otherwise the evaluation would have ended up costing more than the training programme for another ten teachers.

In another programme evaluation, our client wants to evaluate whether their training impacts positively on small businesses’ turnover and their own company’s (a company that markets their products through these small businesses) bottom line. Luckily they have information on who attended the training, how much they ordered before the training and how much they ordered after the training. It is also possible to triangulate this with information they collected about the small businesses during and after the training workshop. This data has been sitting around and it is doubtfull that any impact beyond the financial impacts will be of interest to anyone.

Although both of these evaluations were designed to deliver some sort of information about the “impacts” they deliver, they still do not measure the social impact of these initiatives properly. A report from the “Evaluation Gap Working Group” raises this question and suggests a couple of strategies that could be followed in order to find out what we do not know about the social intervention programmes we implement and evaluate annually.

I suggest you have a look at the document and think a bit about how it could impact the work you do in terms of evaluations.

Ciao!

B

* For information about the Kirkpatrick Model, please read this article from the journal: Evaluation and Programme Planning at www.ucsf.edu/aetcnec/evaluation/bates_kirkp_critique.pdf or the following article that is reproduced from the 1994 Annual: Developing Human Resources. http://hale.pepperdine.edu/~cscunha/Pages/KIRK.HTM

* Cook, T.D., and Campbell, D.T. (1979). Quasi-experimentation: Design and analysis issues for field settings. Rand McNally . This is one of the seminal texts about quasi experimental research designs.
Bill Shadish reworked this text and released it in 2002 again. Shadish, W.R. , Cook, T.D., & Campbell, D.T. (2002). Experimental and Quasi-Experimental Designs for Generalized Causal Inference by

* The following post came through the SAMEA listserv and raises some interesting questions about evaluations.

When Will We Ever Learn? Improving Lives Through Impact Evaluation
05/31/2006

Visit the website at http://www.cgdev.org/section/initiatives/_active/evalgap
Download the Report in PDF format at
http://www.cgdev.org/files/7973_file_WillWeEverLearn.pdf (536KB)

Each year billions of dollars are spent on thousands of programs to improve health, education and other social sector outcomes in the developing world. But very few programs benefit from studies that could determine whether or not they actually made a difference. This absence of evidence is an urgent problem: it not only wastes money but denies poor people crucial support to improve their lives.

This report by the Evaluation Gap Working Group provides a strategic solution to this problem addressing this gap, and systematically building evidence about what works in social development, proving it is possible to improve the effectiveness of domestic spending and development assistance by bringing vital knowledge into the service of policymaking and program design.

Q&A: What size should my Sample Be?

Last night I thought of something besides musings that I could post on this blog. Given that I hope this blog will be useful to someone, somewhere, I thought of posting some of the questions and answers colleagues send to me when they need a sounding board. The question I received below is from a friend in one of the Southern African Countries. I attach both the question and the answer for your review. If you have anything to add, please leave a comment.

________________________________________________

Dear B,

Please let me know if what I am asking you is disturbing your busy days and whether I should be paying for the services you are providing me with! I feel bad bothering you incessantly like this however I also feel that in many ways you are the best placed to provide advice with some of the things I am facing here…

Currently, I am preparing for a post-assistance evaluation household exercise to check how the households are using the assistance we are providing them with. Originally we are to do this survey between 4-6 weeks after assistance to see how they used it, what they thought of it, etc. etc. As you will see from the attachment, some of the activities took place a while ago and the survey was not done. In total, we have to create a sample out of 1700 families we have assisted across the various sites.

Everyone has their own opinion on how to sample within each site: just take 10, just take 20 households, count every 5 households and interview them, take a %age per site etc. I need to come up with the right size based on the numbers per site, the total number of households and keeping in mind that capacity is low given the number of sites and few numbers of field staff.

Another suggestion I had from a colleague who is more knowledgeable than most in the office about statistics is to decide on a fix number of households per site (e.g. 20) and decide that 5 must be female-headed, 5 male-headed, 5 child-headed (if exists etc.). Would this work or do we have to know the number of female, male, child-headed households per site?

I wanted to know if you had any suggestions as to how best collect a good sampling size and way of sampling as well. Do you have any suggestions?

Again, please feel free to let me know if you can’t assist

___________________________________

Hi D

It is always nice to hear from you. You have such interesting challenges to deal with and it generally doesn’t take very long to sort it out. Plus it gives me an opportunity to think a bit about things other than the ones I am working on. So please don’t feel bad when you send me questions. If I’m really really busy it will take a couple of days to get back to you – that’s all. PS. The sample size question is the one I get asked most frequently by other friends and colleagues.

A good overview of the types of probability and non-probability samples are available here – http://www.socialresearchmethods.net/kb/sampling.htm . Note that if you are at all able to, it is always better to use a probability sample. The usual way in which household surveys are done is some form of simple random selection, or clustered sample. In other words – A simple random sample means you take a list of all the households, number them and then, using a table of random numbers, select households until you get to the predetermined amount of households. People often think that random selection and selecting “at random” is the same thing, which it obviously isn’t. For clustered samples you may use neighborhoods as your clusters. So if your 1200households are spread across 10 neighborhoods, you may randomly select 3 or 4 neighborhoods and then within each neighborhood, you randomly select households.

In many instances you don’t have a list of all the households so it makes random selection a bit difficult. Then it is good to use a purposive sample or quota sample or some combination of samples. For a household survey on Voluntary Counseling and Testing I did with Peter Fridjhon at Khulisa they used grids which they placed over a map of the area and then selected grid blocks, then streets and then households. This is also a common methodology used for the household surveys conducted by Stats SA. I attach another document with some information about how they went about to draw the sample. My guess is that this approach (or something like it) is the one you would use.

Remember that when “households” are your unit of analysis, you should have strict rules about who will be interviewed. I.e. ask for the head of the household, if he/she is not there, then ask for the person that assumes the role of the head in his/hear absence. Children under age 6 may not be interviewed. If there is no-one to interview then the household should be replaced in some random manner. (It’s always a good idea to have a list with a number of replacement sites available during the fieldwork if this happens.

In terms of sample size – it is a bit of a tricky one especially if you don’t have the resources. It is important to remember that your sample size is only one of the factors that influences the generalisability of your findings. The type of sample you draw (probability or non-probability) is almost as important. I attach a document I wrote for one of my clients to try to explain some of the issues. It also says a little bit about how your results should be weigthed in order to compensate for the fact that a person in a household with 20 members have a 1/20 chance to be selected while a person in a household with 2 members have a ½ chance to be selected.

Back to the sample size issue though – I always use an online calculator to determine what the sample size should be for the findings to be statistically representative. This one http://www.surveysystem.com/sscalc.htm is quite nice because it has hyperlinks that link to explanations of some of the concepts. Remember that if you have sub groups within your total population that you would like to compare, it is important to know that your sample size will increase quite significantly. (The subgroup will then be your population for the calculation)

I would do the following: Check with the calculator how many households you should interview, then use a grid methodology to select the households. If you cannot afford to select as many cases as the sample calculator suggests, then just check what your likely sampling error will be if you select fewer cases.

I don’t know if this made any sense, but if not, give me a shout and I’ll try to explain more.

Keep well in the mean time.

Regards
————————————
Attachment one: Sampling Concepts

The following issues impact how the performance measures are calculated and interpreted.

What is a sample?
When social scientists attempt to measure a characteristic of a group of people, they seldom have the opportunity to measure that characteristic in every member of the group. Instead they measure that characteristic (or parameter as it is sometimes referred to) in some members of the group that are considered representative of the group as a whole. They then generalise the results found in this smaller group to the larger group. In social research the large group is known as the population and the smaller group representing the population is known as the sample.


For example, if a researcher wants to determine the percentage children of school going age that attend school (the nett enrolment rate), she/he does not set out to ask every South African child of school going age if they are in school. Instead she/he selects a representative group and poses the question to them. She then takes those results and assumes that they reflect the results for all learners of school going age in South Africa. The population is all South African learners of school going age the sample consists of the group she selected to represent that population.


What is a good sample?
A good sample accurately reflects the diversity of the population it represents. No population is homogenous. In other words, no population consists of individuals that are exactly alike. In our example – the population of South African children of school going age – we have people of different genders, population groups, levels of affluence, and of course, school attendance, to name just a few variables. A good sample will reflect this diversity. Why is this important?


Let’s consider our example once again. If the researcher attempts to determine which percentage of South African children of school going age attend school, and selects a sample of individuals living in and around Pretoria and Johannesburg, can the findings be generalised with confidence? Probably not. It is reasonable to assume that the net enrolment rate may differ substantially between urban areas and rural areas. Specifically, you are more likely to find a greater net enrolment rate in urban areas. So in this case the sample results would not be an accurate measure of the levels of education for the population.


Sampling error
The preceding example illustrates the biggest challenge inherent in sampling – limiting sampling error. What is meant by the term sampling error? Simply this: because you are not measuring every member of a population, your results will only ever be approximately correct. Whenever a sample is used there will always be some degree of error in results. This “degree of error” is known as sampling error.
Usually the two sampling principles most relevant to ensuring representativity of a sample, and limiting sampling error, are sample size and random selection.

Random selection and variants
When every member of a population has an equal chance of being selected for a sample we say the selection process is random. By selecting members of a population at random for inclusion in a sample, all potentially confounding variables (i.e. variables that may lead to systematic errors in results) should be accounted for. In reference to our example – if the researcher were to select a random sample of children of school going age, then the proportion of urban vs. rural individuals in the sample should reflect the proportion of urban vs. rural individuals in the population. Consequently any differences in net enrolment rates for urban and rural areas are accounted for and any potential error is eliminated.


Unfortunately random selection is not always possible, and occasionally not desirable. When this is the case, researchers selecting a sample attempt to deliberately account for all the potential confounding variables. In our example the researcher will try to ensure that important population differences in gender, population group, affluence etc. are proportionately reflected in the sample. Instead of relying on random selection to eliminate potential error, she/he does so through more deliberate efforts.

Sample size
In terms of sample size, it is generally assumed that the larger the sample size, the smaller the sampling error. Note that this relationship is not linear. The graph below illustrates how the sampling error decreases as sample size increases. The graph illustrates the relationship between sample size and sampling error as a statistical principle. In other words the relationship shown here is applicable to all surveys, not just the General Household Survey.
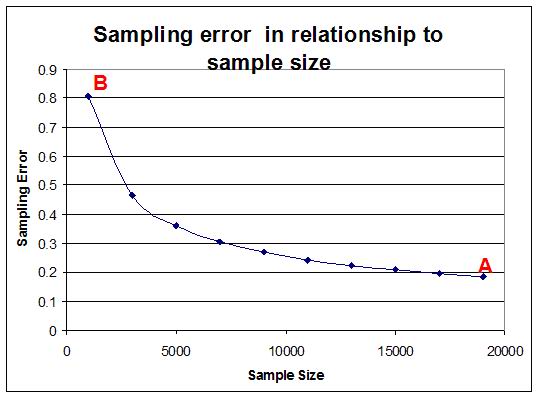

In the General Household Survey, the sample included 18,657 children of school going age for the whole of South Africa. This sample was intended to represent approximately 8,242,044 children of school going age in the total South African population. Because it is a sample there will be some degree of error in the results. However the sampling error in this case approaches a very respectable 0.2% (See point A in the graph above) because of the large sample size.


What does this mean? Well, if we are reporting values for a parameter – e.g. the number of children that are in school – and find that the result for the sample is 97.5%, it means that the same parameter in the population – the number of children that are in school – will range between 97.3% (97.5%-0.2%) and 97.7% (97.5%+0.2%). Note that if the sample included only 1000 people that the sampling error would have increased to 0.8%.

Statistical significance
It is not always correct to manually compare averages and percentages when one is interested in differences between different years’ or different provinces’ results. Percentages and averages are single figures that do not always adequately describe the variance on a specific variable. One needs to be convinced that a “statistically significant” difference is observed between two values before one can say one value is “better” or “poorer” than the other.

In order to make confident statements of comparison about averages, one would need to conduct tests of statistical significance (e.g. a t-test) using an applicable software package. These tests take into account the variance attributable to the sampling error and the normal variance around a mean. A person with some skills in statistical analysis could produce results (In a statistical analysis package or even in a spreadsheet application such as excel) that will allow adequate comparison of means between and within groups.


Weighting
Earlier we mentioned that one of the properties that influence representivity of sample results is whether the people all have the same probability of selection. If one had a complete list of all people in South Africa and a specific address for each one of them, you could have randomly selected people from this list and visited each one of them at their address. In this scenario each person has an equal chance to be included in the sample because you have the relevant details about them.

Unfortunately, researchers rarely have this kind of list and the costs would be very high if you had to visit each of the people you selected at their own address – You would probably end up speaking to one person per address only. To save time and money researchers rather speak to all people in a specific household that they select, but then all of the individuals in the population no longer have the same likelihood to be selected because this is impacted by which households are selected.

The probability of selection is even further complicated if one considers that researcher also don’t have a list with all households in South Africa to randomly select from. To get around this problem they use information about neighbourhoods and geographic locations to identify areas in which they will select households. When a survey uses neighbourhoods or households as a sampling unit, there is little control over the number of persons that will be included in the survey. One household in area A could have 5 people in it and the household next door might have 3 people in it. In order to ensure that the individuals within households (and households within neighbourhoods or household sampling units) are not disproportionately represented in relationship to known population parameters, weighting is applied.

Different weighting procedures can be used to correct for the probability of selection. The weighting procedure is usually selected by statisticians involved with the sampling in the survey. The weight to apply to each individual is usually captured as a variable somewhere in the dataset. Although it is beyond the scope of this manual to explain different ways of weighting it is important to consider that weighting will affect the percentages and absolute numbers produced.

The following table indicates how the percentage of 7 – 14 year olds that indicate they attend school in the General Household Survey differ when weighting is applied and when it is not applied.
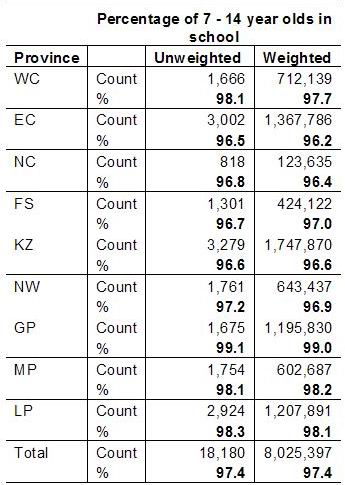
When analysing the data, it is important to ensure that the weighting is taken into account – both when percentages, averages and absolute numbers are computed. It is necessary to use a statistical analysis programme such as SPSS™ or STATA™ to produce any results.

————————————
Attachment two: Household Survey Sampling Approaches

(This was produced by Khulisa Management Services)

For each of the three cities, Khulisa first conducted a purposive geographic sample, to be in alignment with the racial population and Living Standard Measure (LSM) levels three to seven[1] of the geographic area. LSM is used as an indicator of the principle index of the South African consumer market. It was first developed in 1991 by the South African Advertising Research Foundation (SAARF).

For each racial cell in the sampling framework above, the following methodology was used. Four by four, uniform grids were placed over the selected geographic areas. Cells from these grids were randomly selected and a subsequent ten by ten grid placed over the selected cell. A cell from the ten by ten grid was randomly selected after which a street block was selected. A street intersection was noted, and a house was randomly selected (left-side and out of ten houses on the block). The street intersection was the starting point as you move down the street/block. The primary sampling site was located on the left side of the street, with the alternative site being located on the right side of the street. The location of the two primary houses and two replacement houses was given to each fieldworker. This equated to 1200 sample sites and 1200 replacement sites picked from 600 street blocks. This strategy ensured that two fieldworkers – male and female – can work in the same street thus improving the safety levels of the fieldworkers, especially the females.

In an area with apartment buildings (like Joubert Park), after picking the apartment building the fieldworkers were instructed to select the second floor and the number indicated on the instructions for the flat to carry out the interviews.

If there was no house or flat in the pre-selected location, then it was recorded as an Unfeasible Site on the Fieldworkers’ Instrument Control Sheet. Similarly, if there were no eligible respondents in the household, then that was recorded as ALL Ineligible Respondents on the control sheet.

[1] The SABC ConsumerScope (2003) characterizes LSM levels three through seven by the following average monthly household income levels: Level 3: R1104; Level 4: R1534; Level 5: R2195; Level 6: R3575 and Level 7: R5504.

Pet Peeves: Kakiebos & Cosmos

I have been doing M&E for about five years or so. In this time, I have come to develop a list of “Pet Peeves” which I will refer to as the “Kakiebos & Cosmos” list for the purposes of this blog. I am sure that I am not the only person that experience these. And I am sure many of these peeves are not unique to the M&E field. In fact, I would venture to say that these things are probably as common as kakiebos(1) or cosmos(2).
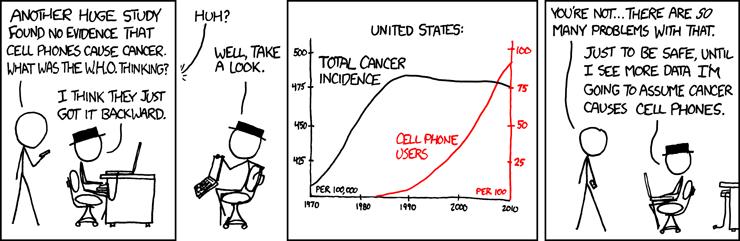
Here is my list:

* “Door stop” evaluations. In other words people commision evaluations that lead to reports that are ever only used as door stops, and nothing else.

* “Lottery” evaluations. These are the kind of evaluations where the client gives you (and 25 other service providers) no more than half a page background about the project and expects you to come up with a 25 page proposal that details exactly what needs to be done… Without any indication of what the budget should be… Its like playing the lottery where you have a one in twenty five chance to actually win the assignment.

*”SCiI Evaluations” These are the evaluations where “Scope Creep is Inevitable” and you end up writing the client’s evaluation report, annual report, management presentation and also plan next year’s evaluation.

*”PR Evaluations” You are engaged to do an evaluation. So you tell the story about the Good, the Bad and the Ugly Fairy Godmother’s role in all of it. When you submit the first draft of your report, your client complains that it “Isn’t what we envisioned”. The euphemism for “What in the world are you thinking? We can’t tell people we did not make any impact! Rewrite the report and change all of the findings so that we can impress the boss / shareholders / board / funder!!!”

* “Pandora’s Box” evaluations. This is the kind of evaluation your clients let you do while they know there are a myriad of other unrelated issues that will make your job close to impossible. These evaluations tend to happen in the middle of organisational restructuring / just before the boss is suspended for embezzling funds / whilst a forensic audit is happening and everyone is in “hiding” / a year after the online database was started without any training for the users

* “Tell me the pretty story” evaluations. These are the kinds of evaluations where you are expected to produce a pretty report full of pictures with smiling faces and heart-rendering stories, without a single statistic that helps the reader to grasp what the costs or benefits of the project / programme was.

Like kakiebos, these types of evaluations are abundant. And not very useful. Sometimes, these evaluations even resemble cosmos. Still thoroughly useless but at least very pretty to look at for short periods of time. In fact, like kakiebos and cosmos, these evaluations just tap resources that should have been available for doing useful things, like growing sunflowers.

Oh, I don’t know. Maybe people that commission / do kakiebos & cosmos evaluations should be sentenced to 100 hours of community service? I think gardening might be a good punishment for them. What do you say?

(1) Kakiebos is the Afrikaans vernacular for the plant Tagetes minuta which is commonly found on disturbed earth e.g. next to roads and is commonly regarded as a weed.
(2) Cosmos is the vernacular for the plant Bidens spp. which is commonly found on disturbed earth e.g. next to roads and is commonly regarded as a weed. In March / April it is, however, quite a spectacular sight to see as these plants carry white, pink and purple flowers.

What this is all about

I am a partner with Feedback Research & Analytics – a South African consultancy that focuses, amongst other things, on conducting monitoring and evaluation (M&E) across various sectors for private companies, NGOs and Civil Society Organisations as well as government departments.

(If you are interested in finding out what the “other things” are that we also do, please visit our website www.feedbackpm.com).

I intend for this blog to become home to some musings about M&E, the challenges that I face as an evaluator and the work that I do in the field of M&E.

If you have anything interesting to add or if you are interested in becoming a contributor to this blog, leave a comment and I’ll get back to you.

Ciao

BvW